| Available in the following formats | 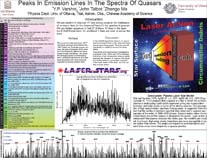 | |
|---|---|---|
| Format | Size | |
| 90 kB (8.5 x 11 inches) 8 pages | ||
| TeX | 28 kB | |
| Poster | 1,493 kB (1.22 x 0.91 meter) | |
| Summary | 3 kB (4 paragraphs) | |
Y.P. Varshni and J. Talbot
Department of Physics, University of Ottawa, Ottawa, Canada, K1N 6N5
Z. Ma
National Astronomical Observatories, Chinese Academy of Sciences, Beijing, 100012, China.
Visiting scientist, University of Ottawa.
Accepted in 1st Crisis in Cosmology Conference, Portugal, June 23, 2005.
| Abstract: It is shown that in a histogram of distribution of emission lines (in the observed frame in the spectra of 5176 quasars, a number of very strong peaks are found at certain wavelengths. The cause and significance of these peaks are discussed. |
| Available in the following formats | | |
|---|---|---|
| Format | Size | |
| 90 kB (8.5 x 11 inches) 8 pages | ||
| TeX | 28 kB | |
| Poster | 1,493 kB (1.22 x 0.91 meter) | |
| Summary | 3 kB (4 paragraphs) | |
We wish to report on a rather remarkable and surprising result in the distribution of emission lines (in the observed frame) in the spectra of quasars. We have found that if a histogram is plotted with frequency of an emission line against the wavelength, a number of very strong peaks are found. Throughout the letter we shall express wavelengths in Angstroms.
We have used the quasar catalog of Hewitt & Burbidge (1993). It lists 7315 quasars, of which 5176 have emission line data. Hewitt & Burbidge (1993) give the emission line wavelengths in the rest frame of the quasar. These were converted to observed frame by multiplying them with (1 + z), where z is the redshift. This resulted in a total of 14,277 lines which span the range 1271 Å to 17993 Å. These were sorted in a numerical order. However, the vast majority of them lie between 3200 Å and 5600 Å and we have confined ourselves to this range.
Histograms were made with number of lines against the wavelength for different bins: 4 Å, 8 Å, 16 Å, 32 Å and 64 Å. We show the result for the 4 Å bin in Figs. 1 and 2. It will be noticed that there are peaks at certain wavelengths. As bin size is increased these peaks gradually disappear, as expected. To allow for the plus/minus uncertainties in the redshifts, a compromise bin of 4 Å was chosen in the subsequent work. To determine the wavelength at which a peak appears more accurately in the 4 Å histogram, histograms were constructed which were shifted with respect to the first histogram by 1, 2 and 3 Å.
To examine the question whether these peaks might be due to random fluctuations, we carried out a Monte Carlo simulation. Using the histogram of observed quasar emission lines with bin size 64 Å as a sufficiently smooth probability distribution, 14,277 random emission lines were generated using a random number generator algorithm from Press et al. (1993).
For verification, we generated a bin 64 Å histogram of the random lines and plotted the results along with the observed bin 64 Å histogram of actual lines and they were found to match very closely.
Next a 4 Å bin histogram was constructed for these random lines. We then generated n=1000 runs of this data and obtain the average 4 Å bin histogram and standard deviation (σ).
Figures 3, 4 and 5 are plots of the observed line distribution in units of σ above this random average. In other words, the ordinate in these two figures represents a function F given by the following equation: (y coordinate in actual distribution - y coordinate of average random distribution) divided by σ.
Figure 3. Observed line distribution in units of σ above the random average for the range 3200-4000 Å.
Figure 4. Observed line distribution in units of σ above the random average for the range 4000-4800 Å.
Figure 5 Observed line distribution in units of σ above the random average for the range 4800-5600 Å.
To determine the statistical significance of these peaks we use the probability under the normal distribution table from Hoel (1984). We find that the probability that a random peak will occur above a given threshold from the random average is
| P(4σ) = 3.16 × 10⁻⁵ |
| P(5σ) = 2.86 × 10⁻⁷ |
| P(6σ) = 9.83 × 10⁻¹⁰ |
| P(7σ) = 1.27 × 10⁻¹² |
| P(8σ) = 6.19 × 10⁻¹⁶ |
We find 37 peaks above 4σ, 13 peaks above 5σ, 3 peaks above 6σ and one peak with 8.4 σ. At 4σ the probability that a random peak will occur above this is low enough and so it was chosen as the cut-off point. This very low probability clearly establishes that the peaks of the 37 lines are significant.
A comparison of these 37 wavelengths with those which are observed in the spectra of Wolf-Rayet stars led to the interesting result that 27 wavelengths (out of 37) are also seen in Wolf-Rayet stars. An additional 5 are seen in novae like stars. Further, one more line is possible in Wolf-Rayet stars.
In Table I we list these 37 lines and the corresponding wavelengths as observed in Wolf-Rayet stars or novae like stars, along with the emitter identification.
| Table I. Wavelength peaks compared with Wolf-Rayet stars | ||
|---|---|---|
| No. | Peak (Å) | Reported wavelengths in WR (Å) |
| 1 | 3356 | 3358.6 Underhill (1959). N III λ3355, O III λ3355.9, C III λ3358 |
| 2 | 3489 | 3493 Wright (1918). O IV λ3490.8 |
| 3 | 3526 | not reported in WR |
| 4 | 3549 | not reported in WR. |
| 5 | 3610 | 3611 Wright (1918), 3609.5 Beals (1930), 3609+ Edlén (1956), 3608.5 Underhill (1959), C III λ3609.6, He I λ3613.6. |
| 6 | 3648 | 3645.4 Underhill (1959). C III, O IV λ3642 |
| 7 | 3683 | 3687 Edlén (1956), 3685.10 - novaelike stars (Meinel et al., 1975). C IV |
| 8 | 3719 | 3722 Plaskett (1924), 3723 Beals (1930), 3722 Edlén (1956), 3717.1 Underhill (1959). O III λ3721 |
| 9 | 3770 | 3769 Plaskett (1924), 3769 Edlén (1956), 3770.6 Underhill (1962). O III, N III λ3773 |
| 10 | 3781 | 3784.8 Underhill (1959). He II λ3781.68, O III, N III λ3779 |
| 11 | 3831 | 3829.9 Underhill (1959). He II λ3833.80, N IV, O VI |
| 12 | 3842 | Not seen in WR. O IV λ3841.07,(?), C III λ3844.51 (?) |
| 13 | 3855 | 3856.6 Underhill (1959). He II λ3858.07 |
| 14 | 3890 | 3889 Wright (1918), 3889 Plaskett (1924), 3888.9 Beals (1930), 3888, 3888.7 Swings (1942), 3887.8, 3890.9 Underhill (1959), 3889.4 Underhill (1962). He I λ3888.64, C III λλ3889.18, 3885.99 |
| 15 | 3903 | 3903.0 - novaelike stars (Meinel et al., 1975) |
| 16 | 3952 | 3953.7 Beals (1930), 3954.4 Edlén (1956), 3954.5 Underhill (1962). O II, (C II) |
| 17 | 4012 | 4008.2 Underhill (1959), 4008.5 Underhill (1962). N III λλ4007.88, 4013.00 |
| 18 | 4135 | O II λ4132.8, Possible in WR stars Edlén (1956) |
| 19 | 4276 | 4275.5 novae (Meinel et al., 1975), 4276.6 novaelike stars (Meinel et al., 1975). O II λ4275.5 Possible in WR (Edlén, 1956) |
| 20 | 4524 | 4519.5 Plaskett (1924) 4521.3 Underhill (1959). N III λλ4523.56, 4527.9, O III λλ4524.2 4527.3, C III |
| 21 | 4647 | 4650.8 Swings (1942). C III λλ4647.40, 4650.16, 4651.35; O II λ4649.15 |
| 22 | 4693 | 4697.0 novaelike stars (Meinel et al., 1975). O II λ4596.2 Possible in WR stars (Edlén, 1956) |
| 23 | 4771 | 4772.1 novaelike stars (Meinel et al., 1975). O IV λ4772.6 Possible in WR stars (Edlén, 1956) |
| 24 | 4801 | 4799 Wright (1918), 4800 Plaskett (1924), 4798.3 Edlén (1956), 4797.4 Underhill (1959), 4798.1 Underhill (1962), 4804.6 Underhill (1962). O IV λ4801 |
| 25 | 4817 | 4814.6 Underhill (1962), 4814.4 novaelike stars (Meinel et al., 1975). O IV λλ4813 4824, Si III |
| 26 | 4910 | 4909.2 Underhill (1959). N III ? |
| 27 | 4925 | 4923 Wright (1918), 4924 Plaskett (1924), 4924 Edlén (1956), 4927.4 Underhill (1959). He I λ4921.9 |
| 28 | 4956 | 4958 Plaskett (1924), 4959.0 novae (Meinel et al., 1975), 4959.0 old novae (Meinel et al., 1975) |
| 29 | 5018 | 5021 Campbell (1894), 5017 Wright (1918), 5018.3 Plaskett (1924), 5018 Beals (1930), 5015.7 Swings (1942), 5018 Edlén (1956), 5019.8 Underhill (1959). He I λ5015.67, C IV λλ5015.9, 5017.7 |
| 30 | 5035 | not seen in WR |
| 31 | 5049 | 5049.9 Underhill (1959). He I λ5047.7, C II |
| 32 | 5096 | 5092.9 Swings (1942) |
| 33 | 5111 | 5111.5 novae-like stars (Meinel et al., 1975) |
| 34 | 5173 | 5171.1 Underhill (1959). N II λ5172 |
| 35 | 5266 | 5266.3 Underhill (1959). C III,O III λ5268.1 |
| 36 | 5345 | 5343.3 Swings (1942). C II λ5336.7 |
| 37 | 5466 | 5470 Wright (1918), 5470 Beals (1930), 5470 Edlén (1956), 5469.6 Underhill (1959). C IV,O V |
We wish to point out that these peaks are not in any way a reflection of the peaks which have been reported in redshift histograms (Burbidge (1968), Wesselink (1970), Karlsson (1971), Burbidge & O'dell (1972), Green & Richstone (1976), Barnothy & Barnothy (1976), Karlsson (1977), Wills (1977), Kjaergaard (1978), Khodyachikh (1979), Box & Roeder (1984), Arp et al.(1990), Burbidge & Napier (2001)) because a peak emission line wavelength often occurs in quasars of very different redshifts. For example λ 3888 occurs in the spectra of quasars with such diverse redshifts: z = 0.39, 0.672, 1.037, 1.51, 1.78, 2.079, 2.20, 2.762. Similarly λ 4026 occurs in the spectra of quasars with such different redshifts: z = 1.11, 1.60, 1.871, 2.08, 2.189, 2.246, 2.31. We have given here just two examples, there are many more.
In the redshift hypothesis there is no reason why the emission lines in the observed frame should show peaks. Thus the redshift hypothesis is unable to account for these peaks.
One of the authors has proposed a theory of quasars Varshni (1973, 1974, 1975, 1977a, 1977, 1978, 1979, 1981, 1985, 1988, 1989), Varshni & Lam (1976), Varshni & Nasser (1986), based on sound physical principles, which does not need the artificial assumption of redshifts and provides satisfactory explanations of the various phenomena associated with quasars. Laser action is responsible for the strength of the broad emission lines. This theory is known as the plasma-laser star model of quasars (PLAST). Most of the observational evidence on quasars either supports our theory or else is consistent with it (see e.g. Varshni (1979, 1981); Talbot & Varshni (1999) and references therein).
The existence of the wavelength peaks can be readily understood on this theory. It is known that some atomic transitions are more susceptible to laser action than others. The peaks correspond to such transitions and such lines occur more often in quasar spectra.
Varshni (1977) has pointed out that there is a continuity between the spectra of certain group of quasars and the spectra of the O VI sequence of Wolf-Rayet planetary nuclei. Varshni (1985, 1988, 1989) has also shown that emission lines of certain quasars also occur in Wolf-Rayet stars. The fact that 27 of the peak lines found in quasars also occur in Wolf-Rayet stars further strengthens the continuity argument. It is also not without significance that line λ3888 which is the most frequently occurring line in quasar spectra also occurs very frequently in Wolf-Rayet spectra. The fact that 5 of the peak lines found in quasars also occur in novae-like stars further suggests that the high velocity end of ejection velocities in quasars is greater than that in Wolf-Rayet stars.