O VI AND He II EMISSION LINES IN THE SPECTRA OF QUASARS
Varshni,Y.P: 1977, Astrophys.Space Sci. 46, 443.
Also available in Adobe Acrobat PDF format.
Abstract.
The plasma-laser star model for quasars, which is based on the hypothesis
that there is no red shift in the spectra of quasars and that the strength
of the emission lines is due to laser action, is further developed.
Continuity is shown to exist between the spectra of O VI sequence planetary
nuclei, Sanduleak stars, and 10 quasars. The O VI λλ3811 Å, 3834 Å and
He II λ4686 Å emission lines in the spectra of these 10 quasars are
identified. Candidate identifications for other quasar lines are also suggested.
Making use of the similarity between the spectra of O VI sequence planetary
and those of the 10 quasars, absolute magnitudes, temperatures, and masses
of these quasars are estimated. The distribution of quasars in galactic
coordinates is also discussed. Three predictions are made.
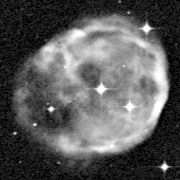
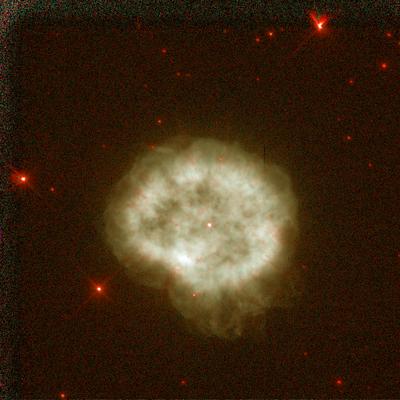
| Hydrogen Alpha Images of Planetary Nebula |
 |
 |
 |
| IC 1747 |
Abell 30 |
NGC 246 |
 |
 |
 |
| NGC 2371 |
NGC 2452 |
NGC 7026 |
 |
 |
 |
| NGC 6905 |
NGC 5189 |
NGC 2867 |
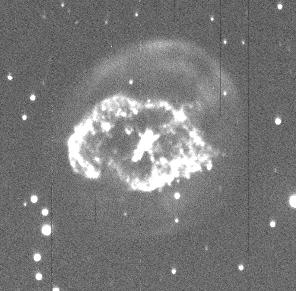 |
| Abell 78 courtesy of M. Horn,
the faint outer halo is composed of normal stellar material
(mostly hydrogen) and the bright inner elliptical ring is composed mostly of helium. |
1. Introduction
The conventional interpretation of the spectral lines observed in quasars is based on the red-shift hypothesis. We
have proposed an alternative explanation (Varshni, 1973, 1974a, b, 1975a) which is based on sound physical
principles and is free of any basic difficulty. The essential ingredients of the new explanation are:
- There is no red shift, and
- The strength of the emission lines is due to laser action (more specifically, due to amplified
spontaneous emission).
The term 'no red shift' here, of course, refers to the large red shifts claimed to occur in the
spectra of quasars. Very small red shifts, z < 10-3, the type encountered in galactic stars, could certainly be
present in the spectra of quasars. Further, it is assumed that the chemical composition of the emission region of
quasars is approximately the same as that of normal stellar atmospheres. This assumption is merely a first
approximation and a convenient starting point. As our knowledge of quasars improves, this assumption can be
suitably modified. The situation is somewhat similar to that of the Wolf-Rayet stars, for which our knowledge of their
chemical composition has been improving with years but is still far from a satisfactory state. These hypotheses lead
to the following picture of a quasar: it is a star in which the surface plasma is undergoing rapid radial expansion
giving rise to population inversion and laser action in some of the atomic species. We call this model the
plasma-laser star (PLS) model.
The proposed model resolves many of the enigmas commonly associated with quasars, and is consistent with
various pieces of evidence (Varshni, 1974b, c, 1975a, b, 1976a, b). Varshni and Lam (1976) have presented model
calculations for laser action in He II λ4686 within the framework of the PLS model.
In the present paper we further develop the thesis that the quasars are stars. We
demonstrate the continuity of the spectra of ten quasars with those of O VI sequence planetary nuclei and stars.
Although the present paper deals with this particular spectral class of quasars, certain general problems concerning
the spectral classification of quasars are also discussed. We identify O VI λλ3811, 3834 and He II λ4686 emission lines
in the spectra of these ten quasars. Candidate identifications for other quasar lines are also suggested. Making use
of the similarity between the spectra of O VI sequence planetary nuclei and those of the ten quasars, we estimate
the absolute magnitudes, temperatures and masses of these quasars. The distribution of quasars in galactic
coordinates is also discussed. Three predictions are made.
2. O VI Sequence Planetary Nuclei and Stars
A line at about 3815 Å in Wolf-Rayet (W-R) spectra has been known since the work of Wright (1918). Beals (1930)
observed two lines, λ3815 with intensity 3, and λ3835 with intensity 2. These two lines were identified by Edlén (1932,
1933) and Payne (1933) as being due to O VI, which has a doublet λλ3811.35, 3834.24 arising from the transition
32S-32P0. The theoretically expected ratio of the intensities of the two lines is 2:1. In Table I we summarize the
wavelengths, intensities and proposed identifications for two lines near λλ3811, 3834 as given by a number of workers.
In the spectra of classical W-R stars, the O VI lines usually occur in the WC class and
O VI emission lines in Wolf-Rayet spectra
are relatively weak. We must note here, however, one important exception. There is a very interesting WN3 star,
HD 104994 ('strangest of all', in the words of Kuhi, 1968), which shows O VI λλ3811, 3834 (Smith, 1955). This
star represents the state of highest excitation among the WN stars.
| TABLE I. O VI emission lines in Wolf-Rayet spectra |
|---|
| Author(s) |
Star |
 |
Intensity
(arbitrary
units) |
Proposed identification |
| Wright (1918) | | 3815 | | |
| Plaskett (1924) | HD 192103 | 3813.5 | 3 | |
| Beals (1930) | | 3815 | 3 | |
| | 3835 | 2 | |
| Aller (1943) | HD 192103 | 3815 | 3.0 | He I λλ3819.6, 3819.7, O VI |
| | 3835 | 2.9 | O VI, He II λ 3833.8 |
| HD 193793 | 3815 | 3 | He I λ 3820, O VI |
| | 3835 | absent(?) | |
| Smith (1955) | HD 119078 | 3809.7 | | O VI |
| (WC7) | | comparable | |
| | 3836.4 | | O VI |
| HD 115473 | 3811 | 21.8 | O VI |
| (WC6) | | | |
| | 3834 | 21.6 | O VI |
| Underhill (1959) | HD 192103 | 3814.6 | medium | He I, He II, O VI |
| | 3833.8 | medium | He II, C II, O VI, S III |
| Aller and | γ2 Velorum | 3811 | 3.0 | O VI |
| Faulkner (1964) | | 3835 | 2.8 | O VI |
Aller (1948) found O VI emission lines in the spectrum of the central star of NGC 246. Greenstein and Minkowski
(1964) investigated the spectra of the central stars of a number of planetary nuclei. They found two of them, A 30 and
A 78 (Abell, 1966), to be of special interest. The O VI doublet is very strong in these stars and two other strong lines
are observed, λλ4686 and 4650. The latter line was identified with C IV λ4658 (this is inferred from the fact that they refer
the excitation potential for the line to be 58 eV). Also, the intensity of this line was found to be variable. Greenstein
and Minkowski (1964) give two spectrograms of A 78; on the first one 4650 is strong, but on the second it is quite
faint. These authors also note that 'several plates of Abell 78 fail to show [N II] or even H &alpha'.
The curious behavior of the relative intensities of 4650 and 4686 in classical Wolf-Rayet spectra has been known for
the last 50 years (Plaskett, 1924). Plaskett (1924) was struck by the remarkable variations in the relative intensities
of these two lines and noted 'The ratio of 4650 C+ to 4686 He+ is also peculiar, as the marked discontinuity at the
third group where the ratio abruptly increases tenfold distinctly shows. Examination of the spectra clearly indicates
that this is almost entirely due to the sudden increase in the strength of the carbon band. Even supposing the
interval between the second and third groups to be greater than between the earlier ones, still the change in the
strength of enhanced carbon at 4650 is more abrupt than shown by any other element and there must be some
physical reason which makes ionized carbon behave in this unique manner.' Such variations can be readily
understood on the basis of laser action (Varshni, 1975a; Varshni and Lam, 1976).
Subsequent investigations by Smith and Aller (1969) showed that in the emission line spectra of certain planetary
nuclei O VI lines attain great strengths, indeed, in some cases these are the strongest lines in the spectrum. These
authors classified the emission-line spectra of planetary nuclei in five classes - one of these is called the
'O VI sequence'. The defining characteristic of this class is the presence of emission lines due to the O VI doublet
λλ3811, 3834 among the strongest lines in the spectrum. In addition, emission lines C IV λ4658 and He II λ4686 are
also present and are usually of comparable intensity to the O VI lines. An infrared photometric survey of 10 of the 12
planetary nebulae in Smith and Aller's list, which have O VI sequence nuclei, has been carried out by Cohen and
Barlow (1974). Four of them were found to have an infrared excess.
We list these 12 planetary nuclei in Table II (category A) in order of increasing strength and width of O VI lines (as
arranged by Smith and Aller, 1969). The widths of the emission lines range from about 40 Å (e.g., NGC 7026 and
NGC 5189) to about 1 Å (NGC 246); when the lines are broad, the two components of the O VI doublet are blended
together, as are the He II λ4686 and C IV λ4658 lines. In Table II for each
nuclei we also give its equatorial and galactic coordinates, distance (d), apparent magnitude (m), absolute
magnitude (M), and absolute magnitude taking into account space absorption (M(a)). Distances are from Cahn and
Kaler (1971); where several values were quoted for the same nuclei, an average was taken. Apparent magnitudes are
from Smith and Aller (1969). The M(a) values were calculated from the formula
M(a)=m + 5 log d - A
In order to obtain A it was assumed that the absorption of star light is 1.9 mag/kpc (Allen, 1973). The scale height for
absorption above galactic plane was taken to be 140 pc (Allen, 1973) and the same value was assumed for the scale
height of absorption below the galactic plane.
| TABLE II. Data for planetary nuclei, Sanduleak stars, and quasars. In general, the number given in the column for m are the photographic magnitudes, except where indicated otherwise by the following letters: B, B magnitude; E, Estimated; U, Uncertain; V, Johnson-Morgan visual magnitude |
|---|
| Object |
R.A. (1950) |
Declination |
lon (deg)
lII |
lat (deg)
bII |
Distance
(kpc)
d |
Apparent
Magnitude
m |
Absolute
Magnitude
M |
M(a)
Eq.(1) |
| Planetary Nebula Nuclei |
|---|
| NGC 246 |
00h44.5 |
-12°09 |
118.8 |
-74.7 |
0.50 |
11.02 |
+2.7 |
+2.4 |
| A 78 |
21h33.4 |
+31 28 |
81.3 |
-14.9 |
+1.83 |
13.04 B |
+1.7 |
+0.7 |
| A 30 |
08h44.0 |
+18 04 |
208.6 |
33.3 |
1.48 |
14.23 B |
+3.4 |
+2.9 |
| IC 2003 |
03h53.2 |
+33 43 |
161.3 |
-14.9 |
4.66 |
17.8 |
+4.5 |
+3.4 |
| IC 1747 |
01h54.0 |
+63 05 |
130.3 |
1.4 |
2.11 |
14.9 |
+3.3 |
-0.7 |
| NGC 1501 |
04h02.7 |
+60 47 |
144.6 |
6.5 |
1.20 |
13.3 |
+2.9 |
+0.6 |
| NGC 2371-2 |
07h22.4 |
+29 35 |
189.2 |
19.8 |
1.58 |
13.2 |
+2.2 |
+1.4 |
| NGC 2452 |
07h45.4 |
-27 13 |
243.4 |
-1.0 |
1.71 |
19.1 |
+7.9 |
+4.7 |
| NGC 2867 |
09h20.1 |
-58 06 |
278.2 |
-5.9 |
2.10 |
14.9 |
+3.3 |
+0.7 |
| NGC 6905 |
20h20.2 |
+19 57 |
61.5 |
-9.6 |
1.63 |
13.9 |
+2.8 |
+1.2 |
| NGC 7026 |
21h04.6 |
+47 39 |
89.0 |
0.4 |
1.62 |
14.8 |
+3.8 |
+0.7 |
| NGC 5189 |
13h30.2 |
-65 44 |
307.2 |
-3.5 |
0.60 |
14.11 B |
+5.2 |
+4.1 |
| Sanduleak Stars |
|---|
| Sand 1 |
01h30.0 |
-73 41 |
299.0 |
-43.4 |
63 (?) |
13 |
-6.0 |
-6.4 |
| Sand 2 |
05h40.0 |
-68 40 |
278.9 |
-31.6 |
52 (?) |
~15 |
-3.6 |
-4.1 |
| Sand 3 |
16h03.1 |
-35 37 |
341.5 |
12.1 |
|
~13 |
|
|
| Sand 4 |
17h42.7 |
-26 10 |
2.4 |
1.4 |
|
13.4 |
|
|
| Sand 5 |
20h19.8 |
37 13 |
75.7 |
0.3 |
|
~15 |
|
|
| Quasars |
|---|
| DW 0202+31 |
02h02 10.0 |
31 57 18 |
140.58 |
-28.14 |
|
18.00 |
|
|
| PKS 2145+06 |
21h45 36.1 |
06 43 41 |
63.66 |
-34.07 |
|
|
|
|
| PKS 2059+034 |
20h59 8.8 |
03 29 49 |
52.69 |
-26.65 |
|
18 E |
|
|
| 4C 33.03 |
01h41 18.0 |
33 57 00 |
135.20 |
-27.41 |
|
17.50 |
|
|
| PKS 0906+01 |
09h06 35.3 |
01 33 40 |
228.95 |
30.92 |
|
17.5 E |
|
|
| 4C 29.68 |
23h25 43.0 |
29 20 00 |
102.06 |
-29.87 |
|
17.30 V |
|
|
| 4C 27.38 |
17h41 57.8 |
27 54 02 |
52.41 |
26.21 |
|
17.7 V |
|
|
| 4C 09.31 |
08h46 57.3 |
10 00 42 |
217.58 |
30.69 |
|
19.2 U |
|
|
| 3C 48 |
01h34 49.8 |
32 54 20 |
133.96 |
-28.72 |
|
16.20 V |
|
|
| 4C 37.43 |
15h12 46.0 |
37 02 30 |
59.87 |
58.32 |
|
15.5 U |
|
|
It was pointed out by Sanduleak (1971) that this unusual variety of Wolf-Rayetlike spectrum (O VI sequence) also
occurs in stars that do not appear to be planetary nuclei. He provides a list of five such stars. Here we shall label
these stars as Sand 1, 2, 3, 4 and 5. Coordinates and magnitudes of these stars are given in Table II (category B).
In Figure 1 we show a diagrammatic representation of the spectra of three of the planetary nuclei namely NGC 6905,
NGC 7026, and NGC 5189, and two of the stars, Sand 1 and Sand 4, belonging to the O VI sequence. Only the
strong lines have been shown. The sources of data and some additional information about these objects and also
Sand 2 are given below.
- NGC 6905 and NGC 7026. Emission-line spectra of nuclei of both of these nebulae have been obtained by Smith and
Aller (1969). Aller (1968) provides the tracings for the range 3200-4700. Recently, Aller (1976) has observed the
central stars of NGC 6905 and NGC 7026 with the Lick Observatory image-tube scanner. He gives scans of NGC
6905 for the ranges 5270-6500 and 6650-8500, and those of NGC 7026 for 5270-8400.
- NGC 5189. The spectrum of the central star in NGC 5189 has been reported by Blanco et al. (1968a) and by Smith
and Aller (1969). Both studies cover the spectral range shortward of 5050 Å. Possible variability in the relative
strengths of the two features has been discussed by Sanduleak (1968).
- Sand 1. This star was discovered by Miss Cannon (1933) in the vicinity of the Small Magellanic Cloud, and classified
as being of O type and having a broad emission feature which apparently she interpreted as He II 4686. Westerlund
(1964) reclassified this star as W-R+O. Sanduleak (1968) obtained a spectrum of this star and found two broad
emission bands centred at 4670±5 and 3840±5 Å, respectively. He gives a microphotometer tracing of the
spectrum for the range 3350-4900.
- Sand 2. Discovered by Sanduleak (1969, 1971) and designated as star -68°145 in the catalog of Large Magellanic
Cloud members.
- Sand 4. Discovered by Blanco et al. (1968b). Its spectrum was first discussed by Blanco et al. (1968c) and later by
Freeman et al. (1968), who give an excellent microphotometer record of the spectrum for the range 3700-7300.
Possible variability in the strength of the emission lines has been reported by Johnson and Golson (1968). In some
of these references, the star has been referred to as GX3 + 1. Cohen and Barlow (1974) have observed a lower limit
of 4.1 for the 10 micron (infrared) magnitude of this star. There is an associated nebula with this star, which,
according to Johnson (1975), 'should qualify as a supernova remnant except for the complication that it contains a
peculiar, hot star'. The radiofrequency spectrum from the nebula appears to be nonthermal (Johnson, 1973).
Fig.1. Diagrammatic representation of the spectra of the following:
(A) Central stars of three planetaries, namely, NGC 6905, NGC 7026, NGC 5189, (B) Stars
Sand 1 and Sand 4, and
(C) Ten quasars. The code for the strengths of the lines is explained at the
top of the diagram. The wavy vertical lines indicate, where known, the limits(s)
of the observed spectrum. For the quasar 4C 29.68, the figure shows the set (c) in Table III;
for 3C 48, it is a composite figure from the two sets of data, and for 4C 37.43, the set (a) has been shown.
The spectrum of the central star of NGC 246 (Heap, 1975) affords an excellent illustration of the O VI lines; the lines
are relatively sharp and their relative intensities appear to be close to the theoretical values (see tracing in Heap,
1975). We note that the nebula is so faint that there is practically no interference by nebular lines on the stellar
spectrum.
However, in some other cases the situation is not so clearcut. It is observed that in some cases where the lines are
broad, 3834 is of comparable intensity to 3811 (e.g., NGC 6905, NGC 7026, see tracings in Aller 1968, also Table I
of the present paper). When the lines are so broad that they are completely blended, it seems that 3834 becomes
stronger than 3811. This statement is based on the following evidence. Sanduleak (1968) has measured the position
of the centre to be 3840±5 Å in Sand 1, and the microphotometer tracing for the spectrum of Sand 4 given by
Freeman et al. (1968) shows the peak to lie at 3850 Å.
When the O VI lines are strong and broad it would be reasonable to assume that the underlying mechanism is the
same as that we have proposed for emission lines in quasar spectra (Varshni, 1974a, 1975a; Varshni and Lam,
1976). To explain the increasing strength of 3834 with the width, the following possibilities are open.
- Under non-LTE conditions the populations of P3/2 and P1/2 levels need not be proportional to their respective
statistical weight. It is possible that the population of the P1/2 level becomes comparable to, or greater than that of
the P3/2 level as departure from LTE conditions increases.
- There is another line or multiplet at 3835 which undergoes laser action when there is high speed expansion. A
possible candidate for this alternative is multiplet 5 of S III (3832-3838).
The existing observational data is inadequate to decide (or to favour) between the two possibilities. We would like to
stress here, though, that the first possibility appears to be more 'natural' than the second one. Irrespective of what is
the correct explanation, the important point to note, for the purpose of our subsequent discussion, is that when the
lines are broad, the peak appears to lie at about 3840 Å.
3.1. The Data
In the course of our analysis of the spectra of quasars (Varshni, 1973, 1974a, 1975a, 1976b) we have found that
there are at least ten quasars whose emission-line spectra (as observed, no red shift) belong to the O VI Sequence;
their coordinates and apparent magnitudes (De Veny et al., 1971) are given in Table II (category C).
The spectral data for these ten quasars are summarized in Table III. For each quasar the first row shows the reported
wavelengths. Below each wavelength, where known, are indicated the strength and width of the line. The following
abbreviations have been used. Strengths: VS=Very Strong, S=Strong, M=Medium, Wk=Weak. Widths: wd=wide (40-100 Å),
mwd=medium (20-30 Å), n=narrow (10-15 Å). The quantitative equivalents, shown in parentheses, are from
Burbidge and Burbidge (1967).
| TABLE III. Emission line data for quasars. Below each wavelength are given, where available, the strength and the width of the line. |
|---|
Quasar
(red shift) |
Set |
1
|
2
|
3
|
4
|
5
|
6
|
7
|
8
|
9
|
10
|
11
|
| DW 0202+31 | | 3823 | | 4708 | | | | | | | | |
| (1.466) | | S, mwd | | M, wd |
| PKS 2145+06 | | 3824 | | 4682 | | | | | | | | |
| (0.367?) | | Wk, wd | | Wk, wd |
| PKS 2059+034 | | 3840 | | 4686 | | | | | | | | |
| (0.370) | | M, wd | | Wk, wd |
| 4C 33.03 | | 3808 | | 4687 | | | | | | | | 6861 |
| (1.455) | | Wk, wd | | Wk, wd | | | | | | | | Wk, wd |
| PKS 0906+01 | | 3843 | | 4695 | | | 5662 | | | | | |
| (1.018) | | Wk, wd | | Wk, wd | | | M, wd |
| 4C 29.68 | (a) | 3846 | | | | | 5639 | | | | | |
| (1.015) | | M, 35 Å | | | | | Wk, 35 Å |
| (b) | 3834 | | | | | 5625 | | | | | |
| (1.009) | | | | | | | |
| (c) | 3841 | | 4675 | | | 5645 | | | | | |
| (1.013) | | Wk, 95 Å | | Wk, mwd | | | Wk, wd |
| 4C 27.38 | | 3837 | 4591 | 4700 | 5114 | 5310 | 5631 | | | | | |
| (0.372) | | S, 10 Å | Wk, 10 Å | Wk, 10 Å | M, 10 Å | M, 10 Å | M, 10 Å |
| 4C 09.31 | | 3822 | | 4681 | 5088 | 5285 | | | | 6628 | 6774 | 6841 |
| (0.366) | | 20 Å |
| 4C 48 | (a) | 3832.3 | 4575 | 4685 | 5097 | 5288 | | 5935 | 6349 | 6646 | | |
| (0.3675) | | S, 70 Å | Wk, mwd | M, mwd | M, n | Wk, n | | S, mwd | Wk, mwd | VS, wd |
| (b) | | | | 5099.4 | | | | | | 6781.7 | 6849.6 |
| (0.3679) | |
| 4C 37.43 | (a) | 3837 | | 4691 | | 5301 | | 5969 | | 6640 | 6799 | 6862 |
| (0.370) | | M, mwd | | Wk, mwd | | M, mwd | | S, wd | | M, 160 Å | M, n | M, n |
| (b) | 3833 | | 4704 | | 5301 | | | | 6638 | 6800 | 6862 |
| (0.371) | | M, 50 Å | | Wk | | Wk | | | | M, 100 Å | 10 Å | M, 10 Å |
| |
|---|
Wavelengths which are close to each other have been placed in the same vertical column. Lines in each column will
be identified by the number at the top. The reported apparent red shift is given in parentheses below the name of
each quasar. In addition, in the following, we give some other relevant information on these quasars, together with
the sources of data. Where more than one set of data are available, these are labelled (a), (b) etc. and the sources
identified below. In those cases where the spectral range observed has been given by investigators, it is noted.
- DW 0202+31. The data are due to Burbidge (1970).
- PKS 2145+06. We quote verbatim from Kinman and Burbidge (1967) and Burbidge (1968). Kinman and Burbidge
(1967): 'Lines at 3824 and 4682 Å were measured in 2145+06, and these are probably Mg II 2798 and [Ne V] 3426,
with a red shift z = 0.367. However, H beta should then appear at 6643 Å, and we have not seen this line on
spectrograms taken in the red with the image-tube spectrograph. This possible red shift needs confirming.' Burbidge
(1968): 'Kinman and Burbidge (1967) obtained several spectrograms of this object and measured broad emission
features at 3824 and 4682 Å. We tentatively identified these as Mg II 2798 and [Ne V] 3426 at z = 0.367, but H beta,
which should have appeared at 6643 Å, was absent. Therefore, we did not include this object in our table of red
shifts. Two further spectrograms have been obtained, one with each spectrograph. The two lines are less distinct,
although 3824 is certainly still visible, and again no other features can be seen. The red shift is thus still not
definitely determined.'
- PKS 2059+034. The spectral data are due to Burbidge and Strittmatter (1972). Photographic spectrograph was used
which covers the spectral range 3200-5000 Å.
- 4C 33.03 (3C 48/54). The spectrum of this quasar has been reported by Burbidge (1970).
- PKS 0906+01 (4C 1.24). Data are due to Burbidge and Strittmatter (1972). Both the photographic spectrograph
(spectral range 3200-5000 Å) and the Carnegie image-tube spectrograph (spectral range 4000-7200 Å, low
resolution) were used.
- 4C 29.68 (CTD 141). Three sets of data are available.
- (a) Schmidt (1966) observed it in the spectral region 3200-6200 Å.
- (b) Lynds' (1967) spectroscopic material was obtained with the Cassegrain spectrograph of the Kitt Peak 84-inch telescope.
- (c) The third set is due to Kinman and Burbidge (1967), who note that the line seen by them at 4675 Å
was not measured by either Schmidt or Lynds.
- 4C 27.38. The data are due to Schmidt (1974). This quasar is one of 39 investigated by Schmidt (1974), and he
states 'The spectra usually cover the range 3200-6700 Å for each object'. He also states that for this quasar 'All the
lines are unresolved, i.e., less than 10 Å wide'. If this finding is confirmed by independent observations, the spectrum
of this quasar could be used for accurate determinations of the emission line wavelengths, which would be of
considerable value in their identification.
- 4C 09.31. The spectrum of this quasar was obtained by Lynds and Wills (1972) at the Kitt Peak National
Observatory. The wavelength region covered is not given, nor are the intensities and widths of lines, except in one
case where the width is noted. The wavelength values given in Table III are the calculated ones obtained from their
supposed red-shifted identifications and the apparent red shift.
- 3C 48. Preliminary observations of the spectrum of this quasar were reported by Greenstein and Munch (1961) and
by Matthews and Sandage (1963). Greenstein and Matthews (1963) interpreted the spectral lines on the red-shift
hypothesis and a detailed study was made by Greenstein and Schmidt (1964). The first set of data given in Table III
are from the last named source. Greenstein and Schmidt (1964) have given numerical estimates (on a relative scale)
for the intensities of emission lines. For comparative purposes we have converted them into qualitative measures like
'strong', 'medium' etc. In addition to the lines recorded in Table III, three very weak lines at 4065.7, 4205.3 and
5136 Å, respectively, are also present. Ford and Rubin (1965) obtained the spectrum of 3C 48 with the aid of a cascaded-
image tube using the Perkins 69-inch telescope at Lowell Observatory. They give a tracing of the spectrum for the
range 4200-7500 Å, however, no measured wavelengths are given. Wampler et al. (1975) have carried out
observations of the nucleus of 3C 48 and also that of the nebulosity surrounding it, using the image-tube scanner
(Robinson and Wampler, 1972) at the Cassegrain focus of the Lick 120-inch telescope. Their observations cover the
spectral range 4800-7000. In addition to the three lines listed in the row labelled (b) of Table III, there are features in
their scan of the nucleus corresponding to line nos. 5, 7 and 9; however, their wavelengths have not been given by
Wampler et al. (1975).
- 4C 37.43. Two sets of data are available: (a) Burbidge (1968) obtained the spectrogram(s) at the prime focus of the
120-inch telescope at Lick Observatory. (b) Schmidt (1974), who has reported on 39 quasars in his paper, states
'The spectra usually cover the range 3200-6700 Å for each object'. It is interesting to note that a strong line at 5969 Å
reported by Burbidge (1968) was not observed by Schmidt (1974), though obviously the latter's observations
(Table III) cover this region. We note that this line is quite close to the night sky line 5893 and probably this fact has some
bearing on the difference between Burbidge (1968) and Schmidt (1974).
The spectra of these ten quasars are represented diagrammatically in Figure 1.
3.2. Accuracy of the Data
For the purposes of identifying lines and interpreting other features in a spectrum it is of vital importance to know the
accuracy of the reported data. The accuracy of the data depends on a number of factors, of which the two most
important are the size of the telescope and the methods employed to obtain a spectrum. Besides the conventional
direct spectrograph, spectrographs incorporating image tubes have also been used to study the spectra of quasars.
The performances of different image tubes vary considerably and the technique has developed considerably over the
last few years. The accuracy of the data obtained with some of the early models is difficult to assess. The data due
to Burbidge and collaborators were obtained with the 120-inch telescope at Lick Observatory. Some of the data
quoted above were obtained by them using a spectrograph that incorporates an RCA image tube. For this image
tube Wampler (1974) makes the following comment 'The poor contrast performance of the C33011 that Lick
Observatory owns is very striking'. Livingston (1967) has also commented on this problem and gives a quantitative
comparison (in his Figure 6) of spectra obtained by direct photography and those obtained using the image tube.
Lynds (1967) has used an English Electric Valve P829 D image intensifier in conjunction with the Cassegrain
spectrograph of the Kitt Peak 84-inch telescope. The good points and limitations of the image tube used by Lynds
and coworkers are summarized by Livingston et al. (1966). For one of the quasars, 0122-00, Lynds' results can be
compared with the more recent ones obtained by Browne et al. (1975) using an image-tube scanner (Robinson and
Wampler, 1972) at the Cassegrain focus of the Anglo-Australian 3.9-m telescope. Lynds (1967) gives the
wavelengths as 3210, 3947 (strong), and 5797 Å, respectively. The observations of Browne et al. covered the region
3573-6133 Å, and they give the wavelengths as 3968 (Line/Continuum ratio = 0.4) and 5848 Å (Line/Continuum
ratio = 0.6). They also state that 5848 appears to be asymmetric, suggesting self-absorption in the blue wing. It will
be noticed that there are large discrepancies between the two sets of wavelengths. Also, from the data given by
Browne et al. it would appear that 5848 is stronger than 3968, while Lynds' data would appear to imply the reverse.
Did the strength of one or both of the lines change during the interval between Lynds' and Browne et al.'s
observations? What is the accuracy of Lynds' observations? Obviously some light
could have been thrown on these questions if microphotometer tracings were published. Unfortunately,
microphotometer tracings of the emission spectra of only a few quasars (out of about 400 for which data are now
available) have been published.
The quasar spectra share with the Wolf-Rayet spectra the common property of having wide emission lines. We
consider it appropriate to quote Edlen's (1956) opinion on this point: 'It may be remarked, by the way, that it is
practically impossible to describe a Wolf-Rayet spectrum properly by means of a wavelengths list alone. An
exhaustive description of a spectrum of this kind would require, in addition to the table, a spectrum reproduction and
a photometer tracing of the same magnification, which should be large enough for reading off details on an adjoined
wavelength scale. The reproduction of HD 192103 published by Swings (1942) sets an excellent standard with regard
to magnification and gradation.' Edlen's comments about Wolf-Rayet spectra are applicable, if anything, to a greater
degree, for quasar spectra.
As another example of the difficulties in assessing the accuracy and reliability of the published data, we quote the
case of the quasar 2136+14 (=OX 161). Two investigations on this quasar were published in the same month, one
by Wills and Wills (1974) and the other by Strittmatter et al. (1974). Both groups used image-tube spectrographs.
Their data are given in the following, labelled I and II, respectively,
- I 4167 Å (strong), 4794 Å, 5303 Å
- II 4165 Å (Very strong, wide), 4260 Å (Medium, wide), 4820 Å (Weak, wide, possibly confused with night sky), 5302 Å (Medium, medium wide).
Clearly the reality of 4260 and 4794 (or 4820) as being due to the quasar is in doubt. Again, microphotometer
tracings of the spectra of quasar and night sky would have been helpful.
Comparisons such as the ones given above, for quasars for which two or more sets of data are available, show that:
- (a) Wavelengths of lines described as very strong or strong agree to +3 Å, unless the line is very wide, in which
case the difference can be larger.
- (b) Wavelengths of lines described as medium often differ by +10 Å, differences as large as +20 Å are not
uncommon.
- (c) Weak lines reported by one observer are often not reported by another observer at all. Differences in the reported
wavelengths are frequently very large. For very weak lines the situation is even worse.
A subjective factor in the reported wavelengths may also be noted. It is human nature to prefer the data which fits
theory, which in the present context is the red-shift hypothesis. Knowing that there are large uncertainties in the
measured wavelengths, an investigator may tend to unconsciously favor the wavelength which fits the red-shift
hypothesis.
Night sky lines and lines from city mercury-vapour lights also create problems. If a quasar line falls near any of these
lines, it is obvious that there can be considerable uncertainties in the wavelength and strength of the quasar line,
especially if its strength is only medium or weak (see also Roeder and Dyer, 1972).
Allowing for the uncertainties present in the reported data that we have discussed above, the wavelengths in each
vertical column in Table III may be considered to be more or less the same.
3.3. Spectral Classification of Quasars
We have shown in a previous paper (Varshni, 1975a) that the PLS model for quasars predicts large variations in the
relative intensities of lines which are undergoing laser action, and that such variations have been observed in the
spectra of related quasars. The emission-line region of a quasar can be defined by a certain electron density (ne)
and electron temperature (Te). (These values are, of course, some sort of an average over the emission region,
because the emission line region has a certain thickness and it is reasonable to expect that ne and Te will be a
function of the distance from the star.) These variations in relative intensities, however, create problems in the
spectral classification of quasars. Suppose there are some quasars which show emission lines at wavelengths L1,
L2, and L3, some which show emission at L1, L2, some which show L1 and L3, and some others which show L2
and L3. It is readily seen that all these four groups have neighbourly positions on the ne, Te diagram. But in the
spectral classification of astronomical objects, usually some criteria are adopted for membership in any spectral
class. What do we do in the example that we have given ? Should we say that at least one wavelength, say L1
(arising from a certain transition in a certain ion) must be present in all the quasars? That will leave out the group
which shows L2 and L3, though it might be as close to the L1, L2 group as is the L1, L3 group. There is, however, a
difficulty if we require only one wavelength to be the defining characteristic of a spectral class. There are quite often
large uncertainties in the wavelengths of medium and weak lines. It is possible that two or more different transitions
(in different ions) may give laser lines whose wavelengths are close and observationally difficult to distinguish.
Suppose L1 and L1' are two such close wavelengths belonging to two different ions, and let the optimum conditions
for laser action in these lines be given by ne Te and ne', Te' respectively. Generally speaking, ne and Te will be
different from ne' and Te', Because L1 is very near L1', we will not be certain whether we are dealing with the ne,
Te region or ne', Te' region. However, if we decide to make the classification on the basis of two lines, we avoid
this difficulty, because it is very unlikely that in two completely different environments we will find two different pairs
of ions undergoing laser action at the same two wavelengths. In the example given above suppose we require that L1
and L2 should be present in all quasars belonging to a spectral class. This will then leave out yet another group - the
L1, L3 group. It is thus seen that there are problems in the spectral classification of quasars. But we must make a
start somewhere. We have chosen the requirement that at least two wavelengths must be common in quasars
belonging to the same spectral class. In due course, these different spectral classes can be juxtaposed.
In the present instance we require that two emission lines at about 3820 and 4686 Å
respectively be present in a quasar if it is to be a member of the O VI. It will be noticed from Table III and Figure I
that the spectra of the ten quasars therein satisfy this requirement. A scrutiny of Table III indicates that in some
cases the peak of the O VI emission lies at about 3840 Å - we have earlier drawn attention to a similar situation in
the spectra of the stars Sand 1 and Sand 4. It will also be noticed that these quasars can be divided into three
groups according to their red shifts. These occur at z = 0.37, 1.015, and 1.46. We have noted in a previous paper
(Varshni, 1976b) that some quasars with very different red shifts belong to the same spectral class; the present
example illustrates that point. We may also note here that probably there are a few other quasars, which belong to
the O VI sequence; however, the available data for these quasars are either incomplete or not accurate enough, or
both.
4. Line Identifications and Comparison of Spectra
4.1. General Remarks
The identification of a spectral line from an astronomical source, at any given point in time, is a function of a number
of factors:
- Accuracy of the observed wavelength. When a line is broad, one naturally has to allow a certain amount of
uncertainty in its wavelength.
- Extent of the available laboratory data at that time.
- A reasonable guess as to the composition of the emission region in the astronomical source and the conditions
of excitation in it.
- Self consistency in the proposed identifications for various lines.
In actual practice, tradition has also played an important part. As our knowledge of factors (1)-(4) improves with time,
the identification of a spectral line goes through a process of evolution, gradually (or sometimes by a big quantum
jump) reaching a state of almost certainty. Perhaps those who are familiar with the history of the identification of the
D3 line, 'nebulium' lines and 'coronium' lines will be able to appreciate these remarks better.
When the emission lines from an astronomical source are broad, their identification poses especially difficult
problems. The centre of the line is difficult to determine, and if the profile is asymmetrical this difficulty is further
compounded. In addition the lines are sometimes blended, further confusing the picture.
The history of the identification of 4650 in Wolf-Rayet spectra may be given here as an illustration. Plaskett (1924)
thought this line was due to C II, Beals (1930) attributed it to C III. Edlen (1956) considers it to be a blend of C III and
C IV. Smith and Aller (1969) identify it with C IV λ4658.
4.2. Line Identifications and Discussion
It would obviously be of interest to compare the spectra of O VI sequence planetary nuclei, Sanduleak stars, and
quasars in the high wavelength region. However, amongst planetary nuclei there are only two nuclei (NGC 6905 and NGC 7026)
and amongst Sanduleak stars, there is only one star (Sand 4) for which spectra are available for the long wavelength region; there
are no published data for other objects for wavelengths greater than 5050 Å. We shall compare the spectra of these
three stars with the spectra of the ten quasars shown in Figure 1, in the context of line identifications which we now
consider.
- Line no. 1. O VI doublet.
- Line no. 2. It occurs only as a weak line in two quasars. Lines at about this wavelength have been known in classical
W-R spectra for many years. We divide these lines in three groups according to their wavelengths. Some of the
reported wavelengths and assignments of lines in these three groups are: (i) 4577, 4581 Å, Si III (Bears, 1930),
4572.8 Å, Si III (Swings, 1942), 4575.2 Å, O III, O IV (Underhill, 1959), (ii) 4585.2 Å, C III (Underhill, 1959), (iii) 4592 Å
(Campbell, 1894), 4593 Å (Wright, 1918), 4593 Å (Bears, 1930), 4593.6 Å, C III (Underhill, 1962).
- Line no. 3. He II 4686 and another line, which very likely is C IV λ4658. We have noted earlier the large variations in
the intensity of the latter line. It seems that in most of the quasars considered here the contribution due to C IV 4658
is not very significant.
- Line no. 4. A weak line at about 5090 Å occurs in Sand 4, which Freeman et al. (1968) have attributed to C IV 5093.
In classical W-R spectra, Swings (1942) has reported a line at 5092.9 Å, and Underhill (1959) at 5090.8 Å. Underhill
(1959) also attributes this line to C IV. However, Moore (1970) does not list any line at about this wavelength for C
IV.
- Line no. 5. There is a strong line in NGC 6905 and a medium strength line in NGC 7026 at about 5292 Å, which Aller
(1976) identifies with O VI 5292. There is a strong, wide line at 5293 Å in Sand 4. Freeman et al. (1968) consider the
contributors to be C III 5273, O IV 5305, and O VI 5291. A line at about this wavelength has been known in W-R
spectra since the work of Wright (1918), some of the reported wavelengths and assignments are: 5305 Å (Wright,
1918), 5304.67 Å, O IV (Swings, 1942), 5303.7 Å, C III, O IV (Underhill, 1959).
- Line no. 6. Swings (1942) has reported a line at 5650.8 Å, and Underhill (1959), at 5651.3 Å in W-R spectra. The
emitter is believed to be C II.
- Line no. 7. A tracing for 3C 48 given by Greenstein and Schmidt (1964) shows this line as a bump in the shoulder of
the strong night sky line 5893. It seems that the wavelength and other characteristics of this line are not well
determined, being dependent on the accurate subtraction of the night sky line contribution. We have noted earlier
that while Burbidge (1968) has reported this line in the spectrum of 4C 37.43, Schmidt (1974) has not.
- Line no. 8. It has been reported in only one quasar, 3C 48. Underhill (1959) has reported a weak line at 6350.7 Å in
the W-R star HD 192103, and she attributes it to C III.
- Line no. 9. A weak line in W-R spectra has been reported at 6632 Å and attributed to O IV (Meinel et al., 1975).
- Line no. 10. In W-R spectra a blend of lines due to C II, multiplet 14, having a strong component at 6784 Å has been
reported. There is also a line at 6804 Å, which has been attributed to C III (Meinel et al., 1975).
- Line no. 11. Lines at 6857, 6863 and 6872 Å due to C III, multiplet 19, have been observed in the W-R spectra
(Meinel et al., 1975).
Thus it is seen that three of the lines which have been observed in quasars have also been observed in NGC 6905
and NGC 7026. Sand 4 has several lines common with quasar lines. Also, practically for all the quasar lines,
corresponding lines have been observed in the W-R spectra. The difficulties encountered in the identification of broad
emission lines are well known. In the case of quasars one is further handicapped by the lack of microphotometer
tracings and the uncertainties in the reported data. For line numbers 1 and 3 the identifications are reasonably
secure. For others, we have noted the suggested identifications for the corresponding W-R lines. These could serve
as a good starting point at a later date. Laser action is possible in numerous spectral lines under appropriate
conditions. At the present time we consider it is important to know first the wavelengths and other characteristics
(strength, width, profile) as accurately as possible. A comparative study of the spectra of the ten quasars considered
in this paper, over a wide wavelength interval, with the aim of obtaining the highest possible accuracy in the data,
preferably using the same telescope, would be of considerable importance. It would greatly help the task of
identification of the spectral lines, enable us to find interrelations amongst these quasars, and improve our
understanding of the conditions in the emission-line region. We appeal to the astronomers who have access to large
telescopes to undertake such a study.
Some interesting differences between the spectra of some of the objects considered here may be noted. Hα appears
with great strength in NGC 7026 but is completely absent in A 78 (Greenstein and Minkowski, 1964). This is
obviously connected with the fact that many of the planetary nuclei are known to be deficient in hydrogen. Sand 4
also does not show Hα (there is only a small spike on the tracing of the spectrum due to the nebula). The blend
of C IV 5801, 5812 appears with great strength in NGC 6905, NGC 7026 and Sand 4, but none of the ten quasars
appear to have this. It may be noted, however, that some of the quasars have not been investigated in this region.
Also, these lines are not far from the night sky line 5893 and could have been confused with it.
From our discussion of the spectra of O VI sequence planetary nuclei, Sanduleak
stars, and quasars we are led to infer that these are related objects. However, their
family relationship is far from clear. As far as the spectra are concerned, Sand 1,
Sand 2, Sand 3, and Sand 5 appear to be indistinguishable from quasars. Sand 4 has
associated with it what Johnson (1975) calls a 'counterfeit' supernova remnant. Some
questions naturally present themselves. Is there a genetic relationship between
quasars and planetary nuclei ? Is a quasar an evolutionary stage of a star preceding
the formation of a nebula or does it represent the stage when the nebula has completely dissipated?
It is worth noting that 3C 48 has a nebulosity associated with it,
which would appear to suggest that perhaps the first possibility is more likely. Could
it be that some quasars may have extended nebulae (or perhaps H II regions) of such
low surface brightness that they are undetectable? We note that A 30 and A 78 have
just such extended and faint nebulae (Greenstein and Minkowski, 1964; Abell, 1966).
It is known that planetary nuclei show emission-line spectra in many cases, and
these are of varied types, with certain features having no equivalent among spectra of
Population I stars (Vorontsov-Velyaminov, 1962; Smith and Aller, 1969). In view of
what we have said earlier, it is not surprising to find that quasars show such richness
of variety in their spectra.
5. Other Properties
Having established the spectral continuity between O VI sequence planetary nuclei,
Sanduleak stars and ten quasars, we can now attempt to guess some other properties
of quasars belonging to this sequence. Quite often similarities in the spectra of two or
more stars also imply similarities in some of their other properties, e.g., absolute
magnitude, temperature and mass; but it is well to bear in mind that it is not neces-
sarily always so. For example, Smith and Aller (1971) have shown that the spectra of
a planetary nucleus, BD+30°3639 (Campbell's hydrogen-envelope star), and a
classical Wolf-Rayet star, HD 164270, are very similar, though the two stars are
apparently of different masses, luminosities, and population types.
5.1. Magnitudes
It will be noticed from Table II that the apparent magnitudes of O VI sequence
planetary nuclei (category A in Table II) are spread over the range 11.2 to 19.1 - a
dispersion of 7.9 magnitudes. And this is not all due to their different distances as
can be seen from the absolute magnitudes which range from +1.7 to +7.9 (dispersion
of 6.2 magnitudes). This dispersion is somewhat further reduced if we allow for the
space absorption. The spread in M(a) values is of 5.4 magnitudes.
When we consider the two stars Sand 1 and Sand 2, we are, however, faced with a
puzzle. The apparent magnitudes of these two stars are similar to those in category A,
but if we consider absolute magnitudes (which are calculated assuming that these are
associated with the Small and Large Magellanic Clouds, respectively) we find that
Sand 1 and Sand 2 are brighter than the brightest category A star by 7.7 and 5.3
magnitudes, respectively. These figures are changed to 5.7 and 3.4 magnitudes if
space absorption is allowed for. Two possibilities exist; we shall discuss the pros and cons of both.
- These are indeed bright objects. The example of BD+30°3639 and HD 164270 quoted earlier will support this hypothesis. One
may raise the question as to why such objects have not been found in our galaxy. It is possible that Sand 3, Sand 4,
and Sand 5 belong to this category, but their distances are not known.
- The possibility exists that Sand 1 and
Sand 2 might be foreground stars and not belong to the Small and Large Magellanic Clouds, respectively, as radial-
velocity confirmation is lacking (Sanduleak, 1971). In that case these stars can be expected to have the same sort
of distances as category A stars and consequently their absolute magnitudes will also lie in the same range of
values as those of category A stars.
Clearly, an unequivocal decision is not possible with the presently available
evidence. By analogy we estimate that the absolute magnitudes of quasars are fainter than M = -6 or +1, depending
on the two possibilities.
5.2. Distribution in Galactic Coordinates
Fig. 2. Distribution, in galactic coordinates, of about 400 quasars. In some of the
crowded fields, all quasars have not been shown. The region enclosed by the dashed
curve represents approximately the part of the sky which is inaccessible to telescopes
based in California and Tucson, where most of the spectral work on quasars has been carried out.
If we exclude stars in categories A and B which lie between b" = +10° and -10°, we find that the angular distribution
of the ten quasars in category C is not unlike these stars. This exception of the zone between b" = +10° and -10°
has to be considered in the broader context of quasars in general.
In Figure 2 we show the distribution of about 400 quasars in galactic coordinates. It will be noticed that only two
quasars have been reported between b" = +10° and -10°, and in general there is a scarcity of quasars at low
galactic latitudes. We believe the reasons for this sparseness are the following. A strong belief amongst quasar
investigators that these are extra-galactic objects and so they should be searched for outside the 'zone of avoidance'
for galaxies, which is roughly between b" = +10° and -10°. Some of the existing catalogs which are used as a
starting point for quasar searches are confined to high galactic latitude objects. For example, LB and PHL catalogs
are especially devoted to faint blue stars at high galactic latitudes. Similarly, the Parkes catalog excludes the
regions near the galactic plane, except those between l" ~ 165° and 210°.
It is known that there is a moderate crowding of planetaries towards the plane of the Galaxy (Perek and Kohoutek,
1967). From the similarities that we have drawn between planetary nuclei and quasars, we are led to expect that
quasars should also occur near the galactic plane.
The average apparent magnitude of the twelve planetary nuclei in Table II is 14.5, and that of the nine quasars is
17.4. Thus the number of quasars that we can expect to observe in the zone b" = +10° to -10° will not be very
large.
An underexposed spectrogram (which will suppress the nebular lines) of an O VI sequence planetary nucleus whose
spectrum exhibits broad emission lines will be difficult to distinguish from a quasar spectrum. Indeed, as far as the
spectra of stars like Sand 1, Sand 2, Sand 3 and Sand 5 are concerned, these stars can be considered as quasars,
and can be assigned 'red shifts' of ~ 1.46 or ~ 1.015 following the usual
procedures of red shift determination (Schmidt, 1965). Sand 4 exhibits very faint nebular lines and if we ignore them,
its spectrum becomes just like a quasar spectrum. Sand 5 has b" = 0.3° and it can be considered to belong to the
population of quasars in the zone b" = +10° to -10° that we have predicted earlier.
5.3. Temperatures, Masses
All available estimates (Season, 1966; Capriotti and Kovach, 1967; Lang, 1974; Heap, 1975) of the temperatures of
O VI sequence planetary nuclei indicate that these have very high temperatures, approximately in the range
70 000 - 200 000 K.
By analogy, it would be reasonable to infer that the O VI sequence quasars have the same sort of
temperatures. These estimates of temperature are consistent with the model results for laser action in He II λ4686
(Varshni and Lam, 1976) and with the fact that quasars are blue in colour.
The masses of most of the planetary nuclei are believed to lie in the range of about 1 to 1.5 Mo, though some might
have their mass as low as 0.85 Mo and some as high as 4 Mo (Salpeter, 1971). In general, similar values can be
anticipated for the masses of quasars.
6. Predictions
Finally, on the basis of our study, we venture to make the following predictions.
- Most of the quasars in our list should show the resonance line He II λ303.8.
- The line He II λ3203 should be observable (though weak as compared to He II 4686)
in some of the quasars considered in this paper. The reasons are as follows. We have carried out calculations
(similar to those of Varshni and Lam, 1976) for the occurrence of laser action in He II λ3203. The results suggest that
over certain regions in the ne, Te diagram, laser action in He II λ4686 should be accompanied with laser action in
He II λ3203. Also, the central stars of NGC 6905 and NGC 7026 both show He II λ3203 (Aller, 1968).
- A good number of quasars should be observable in the zone b" = +10° to -10°.
Acknowledgements
The author wishes to thank Dr L. H. Aller (Los Angeles) for making available his scans of the central stars of NGC 6905 and NGC 7026 prior to publication, Professor T.-Y. Wu (Buffalo) for helpful discussions and correspondence,
and Dr B. A. Logan for improving the manuscript. The work was supported in part by a research grant from the
National Research Council of Canada.
Note added in proof. It is of interest to note that recently A. Stockton
(1976, Astrophys. J. Letters 205, L113) has
reported the existence of a nebulosity surrounding the quasar 4C 37.43. Also, the distribution of the nebulosity
around 4C 37.43 is similar to that of the nebulosity around 3C 48, both in extent and in general appearance.
References
- Abell, G. O.: 1966, Astrophys. J. 144, 259.
- Allen, C. W.: 1973, Astrophysical Quantities, The Athlone Press, London.
- Aller, L. H.: 1943, Astrophys. J. 97, 135.
- Aller, L. H.: 1948, Astrophys. J. 108, 462.
- Aller, L. H.: 1968, in D. E. Osterbrock and C. R. O'Dell (eds.), Planetary Nebulae, IAU Symp. 34, 339.
- Aller, L. H.: 1976, Mem. Soc. Roy. Sci. Liege Ser. 6, 9, 271.
- Aller, L. H. and Faulkner, D. J.: 1964, Astrophys. J. 140, 167.
- Beals, C. S.: 1930, Publ. Dominion Astrophys. Obs. Victoria 4, 271.
- Blanco, V., Kunkel, W., Hiltner, W. A., Chodil, G., Mark, H., Rodrigues, R., Seward, F., and Swift, C. D.: 1968a, Astrophys. J. Letters 152, L135.
- Blanco, V., Kunkel, W., Hiltner, W. A., Lynga, G., Bradt, H., Clark, G., Naranan, S., Rappaport, S., and Spada, G.: 1968b, Astrophys. J. 152, 1015.
- Blanco, V., Kunkel, W., and Hiltner, W. A.: 1968c, Astrophys. J. Letters 152, L137.
- Browne, I. W. A., Savage, A., and Bolton, J. G.: 1975, Monthly Notices Roy. Astron. Soc. 173, 87P.
- Burbidge, E. M.: 1968, Astrophys. J. Letters 154, L109.
- Burbidge, E. M.: 1970, Astrophys. J. Letters 160, L33.
- Burbidge, E. M. and Strittmatter, P. A.: 1972, Astrophys. J. Letters 174, L57.
- Burbidge, G. and Burbidge, M.: 1967, Quasi-Stellar Objects, W. H. Freeman and Co., San Francisco.
- Cahn, J. H. and Kaler, J. B.: 1971, Astrophys. J. Suppl. 22, 319.
- Campbell, W. W.: 1894, Astronomy and Astrophysics 13, 448.
- Cannon, A. J.: 1933, Harvard Obs. Bull. No. 891.
- Capriotti, E. G. and Kovach, W. S.: 1967, Astrophys. J. 151, 991.
- Cohen, M. and Barlow, M. 1.: 1974, Astrophys. J. 193, 401.
- De Veny, J. B., Osborn, W. H., and Janes, K.: 1971, Publ. Astron. Soc. Pacific 83, 611 and a supplement to it.
- Edlen, B.: 1932, Observatory 55, 115.
- Edlen, B.: 1933, Z. Astrophys. 7, 378.
- Edlen, B.: 1956, Vistas in Astronomy 2, 1456.
- Ford, Jr., W. K. and Rubin, V. C.: 1965, Astrophys. J. 142, 1303.
- Freeman, K. C., Rodgers, A. W., and Lynga, G.: 1968, Nature 219, 251.
- Greenstein, J. L. and Matthews, T. A.: 1963, Nature 197, 1041.
- Greenstein, J. L. and Minkowski, R.: 1964, Astrophys. J. 140, 1601.
- Greenstein, J. L. and Munch, G.: 1961, Ann. Rept. Dir. Mt. Wilson and Palomar Obs., Carnegie Inst. of Washington Year Book, p. 80.
- Greenstein, J. L. and Schmidt, M.: 1964, Astrophys. J. 140, 1.
- Heap, S. R.: 1975, Astrophys. J. 196, 195.
- Johnson, H. M.: 1973, Mem. Soc. Roy. Sci. Liege Ser. 6, 5, 121.
- Johnson, H. M.: 1975, Astrophys. J. 198, 111.
- Johnson, H. M. and Golson, J. C.: 1968, Astrophys. J. Letters 154, L77.
- Kinman, T. D. and Burbidge, E. M.: 1967, Astrophys. J. Letters 148, L59.
- Kuhi, L. V.: 1968, in K. B. Gebbie and R. N. Thomas (eds.), Wolf-Rayet Stars, p. 103, N.B.S. Special
- Publication 307, U.S. Govt. Printing Office, Washington.
- Lang, K. R.: 1974, Astrophysical Formulae, Springer-Verlag, New York.
- Livingston, W. C.: 1967, Advances in Electronics and Electron Physics 23, 347.
- Livingston, W. C., Lynds, C. R., and Doe, L. A.: 1966, Advances in Electronics and Electron Physics 22B, 705
- Lynds, C. R.: 1967, Astrophys. J. 147, 837.
- Lynds, R. and Wills, D.: 1972, Astrophys. J. 172, 531.
- Matthews, T. A. and Sandage, A. R.: 1963, Astrophys. J. 138, 30.
- Meinel, A. B., Aveni, A. F., and Stockton, M. W.: 1975, Catalog of Emission Lines in Astrophysical Objects, The University of Arizona, Tucson.
- Moore, C. E.: 1970, Selected Tables ol Atomic Spectra, NSRDS-NBS3, Section 3, U.S. Govt. Printing Office, Washington.
- Payne, C. H.: 1933, Z. Astrophys. 7, 1.
- Plaskett, J. S.: 1924, Publ. Dominion Astrophys. Obs. Victoria 2, 346.
- Perek, L. and Kohoutek, L.: 1967, Catalog of Galactic Planetary Nebulae, Czechoslovak Academy of Science, Prague.
- Robinson, L. B. and Wampler, E. J.: 1972, Publ. Astron. Soc. Pacific 84, 161.
- Roeder, R. C. and Dyer, C. C.: 1972, Nature Phys. Sci. 235, 3.
- Salpeter, E. E.: 1971, Ann. Rev. Astron. Astrophys. 9, 127.
- Sanduleak, N.: 1968, Publ. Astron. Soc. Pacific 80, 470.
- Sanduleak, N.: 1969, Contrib. Cerro Tololo Inter-American Observatory, No. 89.
- Sanduleak, N.: 1971, Astrophys. J. Letters 164, L71.
- Schmidt, M.: 1965, Astrophys. J. 141, 1295.
- Schmidt, M.: 1966, Astrophys. J. 144, 443.
- Schmidt, M.: 1974, Astrophys. J. 193, 509.
- Seaton, M. J.: 1966, Monthly Notices Roy. Astron. Soc. 132, 113.
- Smith, H. J.: 1955, Ph.D. Thesis, Harvard University, Cambridge.
- Smith, L. F. and Aller, L. H.: 1969, Astrophys. J. 157, 1245.
- Smith, L. F. and Aller, L. H.: 1971, Astrophys. J. 164, 275.
- Strittmatter, P. A., Carswell, R. F., Gilbert, G., and Burbidge, E. M.: 1974, Astrophys. J. 190, 509.
- Swings, P.: 1942, Astrophys. J. 95, 112.
- Underhill, A. B.: 1959, Publ. Dominion Astrophys. Obs. Victoria 11, 209.
- Underhill, A. B.: 1962, Astrophys. J. 136, 14.
- Varshni, Y. P.: 1973, Bull. Am. Phys. Soc. 18, 1384.
- Varshni, Y. P.: 1974a, Bull. Am. Astron. Soc. 6, 213.
- Varshni, Y. P.: 1974b, Bull. Am. Astron. Soc. 6, 308.
- Varshni, Y. P.: 1974c, Astrophys. J. Letters 193, L5.
- Varshni, Y. P.: 1975a, Astrophys. Space Sci. 37, Ll.
- Varshni, Y. P.: 1975b, Astrophys. J. 201, 547.
- Varshni, Y. P.: 1976a, Astrophys. Space Sci. 42, 369.
- Varshni, Y. P.: 1976b, Astrophys. Space Sci. 43, 3.
- Varshni, Y. P. and Lam, C. S.: 1976, Astrophys. Space Sci. 45, 87.
- Vorontsov-Velyaminov, B. A.: 1962, Comm. Sternberg Astron. Inst. 118, 3.
- Wampler, E. J.: 1974, in N. Carleton (ed.), Methods of Experimental Physics, Vol. 12: Astrophysics, p. 237, Academic Press, New York.
- Wampler, E. J., Robinson, L. B., Burbidge, E. M., and Baldwin, J. A.: 1975, Astrophys. J. Letters 198, L49.
- Westerlund, B. E.: 1964, Monthly Notices Roy Astron. Soc. 127, 429.
- Wills, D. and Wills, B. J.: 1974, Astrophys. J. 190, 271.
- Wright, W. H.: 1918, Publ. Lick Obs. 13, Part VI.
Note: A STSci document refers to
NGC 5189 as:
- The GSC object/position is for the hub of the bright bar that looks roughly
like a late-type barred spiral galaxy, which is slightly north of the
geometric centre. -- Brian A. Skiff
The similarity between some planetary nebula and galaxies is striking.
This furthers our evidence that many nebulosities identified as galaxies are really nebulas !
 Laser Stars Home


