The Discontinuity near 3700 Å
Before coming to a discussion and identification of a discontinuity near 3700 Å in the
continuum of the quasars listed in
Table I,
first we give a brief summary of the essential
features of a discontinuity in stellar continuum.
A remarkable feature in stellar spectra are the jumps near the limits of the different
series. This is a consequence of the discontinuous variation of the absorption coefficient.
On crossing a series limit from higher to lower wavelengths, the absorption coefficient
increases discontinuously. Consequently the outgoing radiation flux decreases
discontinuously at these wavelengths. The most commonly observed discontinuity in stellar
spectra is of course the Balmer discontinuity at 3646 Å.

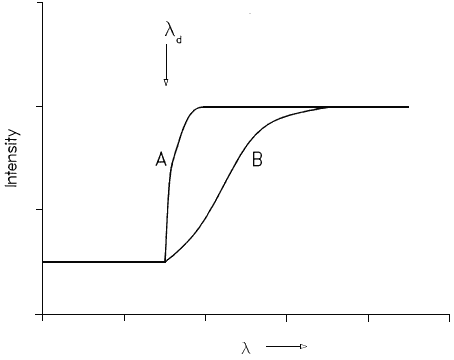
Fig.1. Shape of a discontinuity in stellar continuum spectral energy distribution.
The drop can be rather sharp (curve A) or it can be very smooth and gentle (curve B).
Figure 1 is a schematic representation of the behaviour of the continuum near a
discontinuity. The magnitude of the discontinuity is usually defined by
Chalonge and Divan (1952)
or Aller (1963) as
D=log_10(I+/I-),
where I+ and I- are the intensities for the long- and short-wavelength sides of the
discontinuity (Lambda_d). The quantity D depends on stellar conditions, i.e., Te, Pe and the
composition. The shape of the continuum for Lambda > Lambda_d for two extreme cases is shown in
Figure 1. The drop can be rather sharp (curve A) or it can be very smooth and gentle
(curve B). And, of course, various intermediate cases are possible and are found to
occur. In the neigbourhood of Lambda_d on the long wavelength side, if the depression of the
continuum is substantial, the coalescence of the higher lines of the series may shift the
apparent discontinuity to longer wavelengths. This effect is more pronounced at low
resolution.
Next we summarize the evidence on the discontinuity in the continuum of quasars
listed in
Table I.
- 0420-388. The spectrum given in
Smith et al. (1981)
indicates the position of the discontinuity to be at about 3760 Å but the
spectrum is very noisy in this region.
- 0140-306.
Smith et al. (1981)
give the position of the discontinuity as 3665 Å.
- 0244-3017.
Wolstencroft et al. (1983)
state that a sharp drop in the continuum occurs near 3740 Å.
- 0537-286.
Wright et al. (1978)
observed an extremely sharp drop in the continuum
level shortward of 3650 Å.
Wilkes (1986)
finds the discontinuity to occurs at 3633 Å. However, the noise level of the spectrum
(Wilkes et al., 1983)
shortward of the discontinuity indicates that the discontinuity could equally
well be at a longer wavelength by as much as 50 Å.
- 1244+1129. From the
spectrum
given in
Foltz et al. (1987),
we estimate the position of the discontinuity to be at about 3720 Å.
- 1320-106.
Kunth et al. (1981)
give the spectrum of this quasar, but it is very noisy,
especially in the region of the discontinuity. From their Figure 2(d) (POX 175), we
estimate 3700±30 Å for the position of the discontinuity.
- 2228.2-4033.
Osmer (1979)
gives a very low-resolution plot of log fv versus log v.
From this we estimate the position of the discontinuity to be at 3720±40 Å.
From the foregoing summary it is reasonable to conclude that the position of the
discontinuity lies in the vicinity of 3700 Å. We identify this discontinuity with the helium
discontinuity at 3680 Å (the ionization limit from the 2^1P° state of helium). While
absorption lines from the 2^1P° - n^1D series have been observed in stellar spectra up to 3737 Å
(Thackeray, 1954)
and 3744 Å (Klemola, 1961; Drilling,
1973,
1978),
to the best
of our knowledge, it is the first time that the helium 3680 discontinuity has been
identified in an astronomical spectra. Our arguments in support of this identification are
as follows. A good many absorption lines arising from the 2^1P^o level are observed in
0420-388. The Balmer discontinuity lies quite near the observed value, but as discussed
earlier, in the available data, there is no clear evidence for the presence of hydrogen.
However, should future investigations show the presence of the Balmer series, then
admittedly, our conclusion will require reconsideration.
It would have been of interest to compare the colours of the seven quasars in
Table I.
But, unfortunately, data are available for only one of them, namely 0420-388, for which
the values are: B-V=0.78, U-B=0.90
(Hewitt and Burbidge, 1987),
J-H=0.63±0.11, H-K=0.48±0.16
(Hyland and Allen, 1982).
In analogy with what we found for 0237-233
(Varshni, 1988c)
we expect that on the (U-B), (B-V) and (J-H), (H-K) plots the seven quasars will lie in close proximity.
Recently a quasar, 0420-388B (R.A. 4h20m36.6s, Decl. -38°50'10", V=20.8) has
been discovered (Cristiani and Shaver, 1988) which lies only 2.1 arc min away from
0420-388. It is possible that the two form a wide binary system.
Next Section : Predictions

