Varshni,Y.P.: 1981, Atrophys.Space Sci., 74, 3.
Also available in Adobe Acrobat PDF format.
Abstract. It is shown that the number of redshift systems based on C IV doublets, proposed by Boronson et al (1978) in the absorption spectrum of the quasar PKS 0237-23, is insignificantly different from that that would be expected from chance coincidences. Consequently, these systems and their z-values appear to be devoid of any physical significance.Recently, Boroson et al. (1978, hereafter BSBC) have reported on the absorption spectrum of PKS 0237-23. Six observations made over 3 years were combined to yield wavelengths and equivalent widths of 193 absorption lines in the spectral region 3715-4290 ┼. These authors claim that many of these absorption lines are due to C IV 1548.20, 1550.77 ┼ at various redshifts. A total of 45 redshifts have been claimed.
We have proposed a theory of quasars (Varshni, 1973, 1974a, 1975a, 1977a, b, 1978, 1979. Varshni and Lam, 1976), based on sound physical principles, which does not need the artificial assumption of redshifts and provides satisfactory explanations of the various phenomena associated with quasars. All the observational evidence on quasars either supports our theory, or is consistent with it (Varshni, 1979). Clearly, the claims of BSBC require examination.
C IV 1548.20 C IV 1550.77
____________ ____________
System Equivalent Equiv. Credibility
number z ┼ width(┼) ┼ width R(EW) rating
1 1.4007 3716.9 0.6 3722.8 0.9 0.67 PO
2 1.4174 3742.6 0.3 3748.8 0.2 1.50 PO
3 1.4575 3804.7 0.5 3810.9 0.3 1.67 PO
3a 1.4794 3838.5 1.2 3845.2 0.1 12.00
4 1.5023 3874.2 0.7 3880.3 0.7 1.00 C
4a 1.5063 3880.3 0.7 3886.7 1.9 0.37
5 1.5144 3892.8 0.8 3899.3 0.3 2.67 PR
6 1.5153 3894.1 0.4 3900.7 0.3 1.33 PR
6a 1.5185 3899.3 0.3 3905.5 0.9 0.33
7 1.5260 3910.8 0.2 3917.1 0.2 1.00 PO
8 1.5348 3924.6 0.3 3930.8 0.1 3.00 PR
9 1.5389 3930.8 0.1 3937.2 0.1 1.00 PO
9a 1.5517 3950.6 1.0 3957.0 0.1 10.00
10 1.5546 3954.9 0.1 3961.7 0.2 0.50 PO
11 1.5559 3957.0 0.1 3963.7 0.2 0.50 PR
12 1.5603 3963.7 0.2 3970.6 0.1 2.00 PR
12a 1.5787 3992.3 0.1 3999.0 0.1 1.00
13 1.5950 4017.6 0.7 4024.3 0.3 2.33 C
13a 1.5956 4018.6 0.4 4025.1 1.2 0.33
14 1.5964 4019.8 1.2 4026.3 0.8 1.50 C
15 1.6102 4041.0 0.6 4047.8 0.4 1.50 C
16 1.6146 4047.8 0.4 4054.8 0.1 4.00 PO
17 1.6164 4050.6 0.1 4057.6 0.1 1.00 PO
18 1.6209 4057.6 0.1 4064.4 0.1 1.00 PO
19 1.6311 4073.4 0.1 4080.4 0.3 0.33 PO
20 1.6356 4080.4 0.3 4087.2 0.2 1.50 PR
21 1.6365 4081.7 0.2 4088.7 0.1 2.00 PR
22 1.6399 4087.2 0.2 4093.9 0.1 2.00 PR
23 1.6410 4088.7 0.1 4095.7 0.2 0.50 PO
24 1.6429 4091.7 0.1 4098.5 0.1 1.00 PO
25 1.6443 4093.9 0.1 4100.7 0.1 1.00 PO
26 1.6512 4104.5 0.1 4111.4 0.9 0.11 PO
27 1.6556 4111.4 0.9 4118.2 0.7 1.29 C
28 1.6568 4113.2 0.9 4120.2 1.1 0.82 C
29 1.6581 4115.2 0.4 4122.2 0.2 2.00 C
30 1.6591 4116.9 0.2 4123.7 0.2 1.00 PO
31 1.6598 4117.7 0.2 4124.8 0.2 1.00 PR
32 1.6599 4118.2 0.7 4124.8 0.2 3.50 PR
33 1.6636 4123.7 0.2 4130.7 0.1 2.00 PO
33a 1.6689 4132.0 0.1 4138.7 0.8 0.13
34 1.6703 4134.2 0.9 4141.0 1.1 0.82 C
35 1.6714 4135.9 0.9 4142.7 1.4 0.64 C
36 1.6732 4138.7 0.8 4145.5 0.4 2.00 C
37 1.6747 4141.0 1.1 4147.7 0.5 2.20 C
38 1.6775 4145.5 0.4 4152.1 0.1 4.00 PO
39 1.6820 4152.1 0.1 4159.3 0.2 0.50 PR
40 1.6907 4165.6 0.3 4172.8 0.1 3.00 PR
41 1.7188 4209.3 0.2 4216.1 0.2 1.00 PO
42 1.7240 4217.4 0.1 4224.1 0.1 1.00 PO
43 1.7292 4225.3 0.1 4232.1 0.2 0.50 PO
44 1.7455 4250.6 0.1 4257.6 0.1 1.00 PO
45 1.7533 4262.6 0.1 4269.7 0.2 0.50 PO
BSBC recognized that many systems could arise by chance, and made a statistical assessment of the overall significance of the identifications. Earlier Varshni (1974b, c, 1975b) had emphasized the importance of taking into account the density distribution of lines for determining chance coincidence "redshifts". Since, in the case of PKS 0237-23, the distribution of lines in wavelength is not uniform, BSBC divided the line list into six 100 ┼ regions and calculated the expected number of chance C IV doublets in each region by the following formula E(C IV)=[N(N-1)/L](2deltaLambda)(f), where N is the number of lines in the region, L is the extent of the region, deltaLambda is the required accuracy of the separation, and f is the probability of fulfilling the relative equivalent-width criterion by chance. The quantity f was arbitrarily given a value 0.75 by BSBC. We have noted earlier that in the spectrum of PKS 0237-23 there are 52 systems, of which, BSBC have accepted 45. It would be more logical to assume f=45/52=0.87. If the results of BSBC are taken at face value, these indicate that in two wavelength intervals, namely, 4000-4100 ┼ and 4100-4200 ┼, the number of observed systems is much larger than that expected by chance. Taken together, in the two intervals, there are 28 observed systems, whereas 14.1▒3.5 are expected by chance.

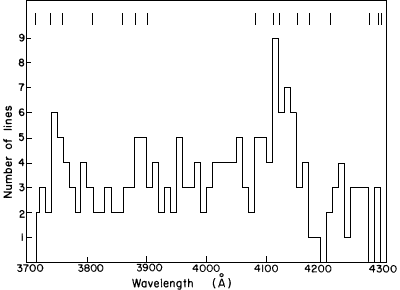
Fig.1. Number of lines in 10 ┼ intervals as a function of wavelength for PKS 0237-23. The data are due to BSBC. The vertical bars at the top indicate the positions of the "walls" used in generating the ghost spectra.
The density of lines plays a very important role in determining chance coincidences (Russell and Bowen, 1929. Russell et al., 1944; Varshni (1974b, c, 1975b). The fluctuations in the density of lines in the spectrum of PKS 0237-23 must be properly taken into account in any calculation of the number of chance coincidences.
For the mathematically-minded reader, we note that the BSBC procedure is equivalent to calculating
[(Sum from i=1 to m of ai)^2 - (Sum from i=1 to m of ai)]/m
as compared to the correct expression:
Sum from i=1 to m of ai(ai-1),
where ai represents a sequence of numbers. Only if the dispersion in the ai values is very small, the two expressions will be close to each other. If the dispersion in the ai's is large, the former expression can be substantially smaller than the latter one.
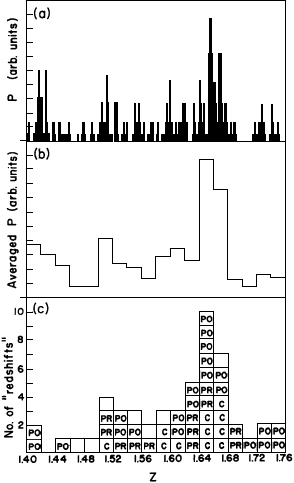
The calculated values of P in steps of deltaz=0.002, as a function of z, are shown in Figure 2(a). These values were averaged over deltaz=0.02 and the resulting histogram is shown in Figure 2(b), which may be compared with the results of BSBC, shown in Figure 2(c). The empty squares in Figure 2(c) represent the systems rejected by BSBC. It will be noticed that the chance-coincidence redshift distribution is very similar to that of the actual systems found for PKS 0237-23. We conclude that the proposed systems are consistent with the hypothesis that these are just chance-coincidences without any physical significance.

Fig.2.
(a) P as a function of z, in steps of deltaz=0.002.
(b) Histogram showing averaged P over deltaz=0.02, as function of z.
(c) Histogram showing the distribution of absorption redshifts.
The credibility rating of the 45 systems of BSBC is indicated by C,PR or PO.
To obtain the actual number of chance-coincidence redshift systems, two methods were used.
Method 1.
A detailed examination of the data of BSBC and Figure 1 shows that
the absorption spectrum of PKS 0237-23 can be conveniently divided into 15
intervals, to allow for the varying density of lines, with `walls' at 3715, 3740,
3760, 3810, 3860, 3880, 3900, 4080, 4110, 4120, 4150, 4170, 4205, 4270, 4285, and
4290 ┼. Ten ghost spectra
(Varshni, 1975b)
were generated on a computer (IBM 360/65).
The fifteen intervals were considered separately; inside an interval, the
ghost wavelengths were generated by the formula
Li(ghost)=Lmin+Ri(Lmax-Lmin),
where Lmin and Lmax represent the lower and upper limits, respectively, of the interval, and Ri is a uniformly distributed random number between zero and one (generated using the RANDU subroutine of IBM's Scientific Subroutine Package). The minimum separation between two lines in the spectrum reported by BSBC is 0.4 ┼; it was constrained that the minimum separation between two wavelengths in a ghost spectrum will be the same. The equivalent width of the ith observed line was assigned to Li(ghost). Thus in any given interval, a ghost spectrum has the same number of lines of various equivalent widths as in the observed spectrum. Each ghost spectrum was analysed for `redshifted' C IV doublets such that the separation between the lines is within ▒0.33 ┼ of the correct separation. The initiating number used for RANDU subroutine for generating the ghost spectrum and the total number of C IV doublets found in each of the ten cases are shown in Table II. We have noted earlier that BSBC have not used any well-defined rule for R(EW) for a system to be `acceptable'. For the ghost spectra, we find that if we use the criterion that R(EW) should lie between 0.11 and 5, approximately 85 percent of the systems are `acceptable'. The average total number of chance C IV doublets is 48.5▒2.1 and about 85 percent of these are in the `acceptable' category.
Ghost Initiating Total
spectrum number number of
number for RANDU C IV doublets
1 28471 53
2 83123 47
3 26687 45
4 42003 48
5 62893 50
6 66981 49
7 10737 47
8 78241 50
9 137 49
10 8873 47
Average 48.5▒2.1
The next, and more interesting, problem is what are these lines due to. We have succeeded in identifying a good many of the lines recorded by BSBC on the basis of the theory of quasars that we have proposed. We shall present these identifications and the arguments to support them in due course. (in Varshni, 1988)
Acknowledgment. This work was supported in part by a research grant from the Natural Sciences and Engineering Research Council of Canada