 NEBULIUMNEBULIUM
A very interesting class of astronomical objects are known as planetary nebulae. To early astronomers these appeared as discs, rather than as points, which is the case for stars. Hence the name. Sir William Huggins (1864) was the first to observe the spectrum of a planetary nebula, we quote from his paper :
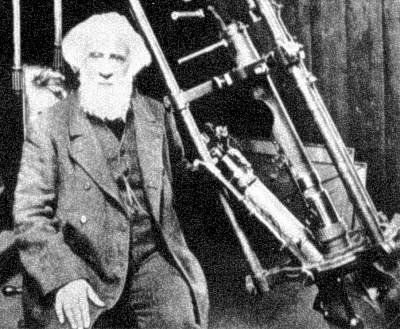 Sir William Huggins:
"On the evening of the 29th of August, 1864, I directed the telescope for the first
time to a planetary nebula in Draco (NGC 6543). The reader may now be able to picture
to himself to some extent the feeling of excited suspense, mingled with a degree
of awe, with which, after a few moments of hesitation, I put my eye to the spectroscope.
Was I not about to look into a secret place of creation ?
Sir William Huggins:
"On the evening of the 29th of August, 1864, I directed the telescope for the first
time to a planetary nebula in Draco (NGC 6543). The reader may now be able to picture
to himself to some extent the feeling of excited suspense, mingled with a degree
of awe, with which, after a few moments of hesitation, I put my eye to the spectroscope.
Was I not about to look into a secret place of creation ?
 Huggins' first stellar spectroscope. A
slit placed in the telescope's focal plane is followed by
a collimator to make the diverging rays parallel, two 60° flint prisms
disperse the light which is then widened by a cylindrical lens, finally
a rotatable viewing telescope controlled by micrometer screw is used to
measure wavelengths.
Huggins' first stellar spectroscope. A
slit placed in the telescope's focal plane is followed by
a collimator to make the diverging rays parallel, two 60° flint prisms
disperse the light which is then widened by a cylindrical lens, finally
a rotatable viewing telescope controlled by micrometer screw is used to
measure wavelengths.
In 1918, W.H.Wright made extensive observations of the nebulae. Among the many lines catalogued less than half were identified, in particular the strong 4959 and 5007 Ĺ pair (also known as N_1 N_2). For a long time this line pair could not be identified and was attributed to a new element, which he named 'nebulium'.
Extensive laboratory studies began accumulating large spectroscopic databases of common elements from arc and spark sources. The fact that 'Nebulium' lines didn't show up led H.N.Russel to conclude that they:
Bowen (1928) first showed that the 'Nebulium' lines which had been observed in the spectra of many cosmic nebulae but were long a complete mystery, were to be explained as forbidden transitions between the deep terms of O+ (4S, 2D, 2P), O++ (3P, 1D, 1S), and N+ (3P, 1D, 1S). The deep terms of the O++ ion is shown in the figure below. Transitions between them involving dipole radiation are strictly forbidden by the Laporte rule, since they are terms belonging to the same electron configuration : 1s2 2s2 2p3 for O+ 1s2 2s2 2p2 for O++ and N+. The positions of these energy levels have been known with great accuracy for a long time from allowed combinations with higher terms. Bowen showed that the wavelengths of the forbidden lines, calculated from the combination of these terms, agree exactly (within the limits of experimental accuracy) with the wavelengths of the unexplained Nebulium lines. Thus it was proved that the Nebulium lines result from forbidden transitions in the O II, O III, and N II spectra, and it was no longer necessary to assume the presence of a new element in these nebulae.
Actually, in cosmic nebulae the conditions are extremely favorable for the occurrence of these forbidden transitions. It is estimated that the densities in the nebulae are of the order of 10^-17 to 10^-20 grams per cubic centimeter. Assuming a plausible value for the temperature (approximately 10,000 K), the time between two collisions suffered by an atom is then 10^1 to 10^4 seconds. Thus, when O+, O++, or N+ ions, which certainly are present, go into these low metastable states by allowed transitions from higher states, they remain there uninfluenced until they radiate spontaneously. A large fraction of the more highly excited ions must come eventually into these states and practically every ion goes from them to the ground state by radiation. This explains why the Nebulium lines are very intense in nebulae, whereas they are not observed in terrestrial light sources, in which the other allowed O II, O III, and N II lines appear strongly.
Additional weaker nebular lines have been identified by various investigators in a similar manner as forbidden transitions of S II, S III, Ne III, Ne IV, Ne V, Ar IV, Ar V, and Cl III. The identity of a few others still remains doubtful (Bowen 1936).
According to Condon, the intense Nebulium lines N_1 and N_2, ascribed to O++, are due to magnetic dipole radiation. Corresponding to this, the 1D2 to 3P0 transition does not appear (cf. the above selection rules). Since we are dealing at the same time with an intercombination (singlet-triplet), the mean life of the upper state is even greater than for quadrupole radiation without intercombination. On the other hand, the green auronal line, as well as the corresponding nebular lines 1D2 - 1S0, is due to quadrupole radiation (delta J = 2, no intercombination).
 O III Energy Levels :
Energy level diagram for the doubly ionized oxygen ion.
The 5006.8 Ĺ and 4958.9 Ĺ transitions are the most intense nebular lines
and are sometimes designated N1 and N2.
(The triplet and doublet splitting is drawn to a much larger scale than the rest of the figure.
Term values are written to the right).
O III Energy Levels :
Energy level diagram for the doubly ionized oxygen ion.
The 5006.8 Ĺ and 4958.9 Ĺ transitions are the most intense nebular lines
and are sometimes designated N1 and N2.
(The triplet and doublet splitting is drawn to a much larger scale than the rest of the figure.
Term values are written to the right).