 DIGITIZED SPECTRA DATADIGITIZED SPECTRA DATA
 Wavelength scale in nanometers and location of primary colors are labeled
on a simulated blackbody spectrum.
Wavelength scale in nanometers and location of primary colors are labeled
on a simulated blackbody spectrum.
![]() At low spectral resolution star spectra appear like a rainbow streak
as seen through a prism or diffraction grating.
At low spectral resolution star spectra appear like a rainbow streak
as seen through a prism or diffraction grating.
![]() At slightly higher spectral resolution, most stars have several absorption
lines which show up as 'notches' of color removed from the continuum radiation
at characteristic wavelengths. They are classified into the spectral types
O, B, A, F, G, K, M; according to the intensity and location of
absorption lines.
At slightly higher spectral resolution, most stars have several absorption
lines which show up as 'notches' of color removed from the continuum radiation
at characteristic wavelengths. They are classified into the spectral types
O, B, A, F, G, K, M; according to the intensity and location of
absorption lines.
![]() Certain rare stars have emission lines which appear as bright lines overlayed
on the darker blackbody continuum. These stars include the
Wolf-Rayets, quasars, central stars of PN etc...
Many of these stars also have prominent absorption lines (not shown).
Certain rare stars have emission lines which appear as bright lines overlayed
on the darker blackbody continuum. These stars include the
Wolf-Rayets, quasars, central stars of PN etc...
Many of these stars also have prominent absorption lines (not shown).
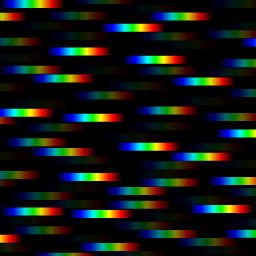
 Simulation of an
objective prism
survey of a starfield. The image also resembles the visual appearance of
a starfield as seen through a diffraction grating.
We made the approximation that all stars are the same brightness
and spectral type, with absorption lines blurred by atmospheric
turbulence. We have purposefully avoided overlapping spectra.
There is a full
1024 X 1024 GIF version
of this image.
Simulation of an
objective prism
survey of a starfield. The image also resembles the visual appearance of
a starfield as seen through a diffraction grating.
We made the approximation that all stars are the same brightness
and spectral type, with absorption lines blurred by atmospheric
turbulence. We have purposefully avoided overlapping spectra.
There is a full
1024 X 1024 GIF version
of this image.
 A more realistic distribution of stellar magnitudes is used
(different brightnesses). There is a full
1024 X 1024 JPG version of this image.
A more realistic distribution of stellar magnitudes is used
(different brightnesses). There is a full
1024 X 1024 JPG version of this image.
 Color coded spectrum plot (on black background) of a typical main sequence
star of spectral type F0V.
There is a less dramatic but more clear version of this plot on a
white background.
Color coded spectrum plot (on black background) of a typical main sequence
star of spectral type F0V.
There is a less dramatic but more clear version of this plot on a
white background.
![]() The NASA computer readable spectra data for most emission
line stars have the continuum extracted for ease of line identification.
This is not good for realistic computer reconstruction of the prism
spectra of those stars. This star is Wolf-Rayet WR138.
The NASA computer readable spectra data for most emission
line stars have the continuum extracted for ease of line identification.
This is not good for realistic computer reconstruction of the prism
spectra of those stars. This star is Wolf-Rayet WR138.
![]() To restore a more natural look to the color spectra we overlay a simulated
blackbody to fill in the continuum between the bright emission lines.
The spectra is much closer to the telescopic view through a diffraction
grating.
To restore a more natural look to the color spectra we overlay a simulated
blackbody to fill in the continuum between the bright emission lines.
The spectra is much closer to the telescopic view through a diffraction
grating.
![]() If the continuum is too bright this reduces the contrast and some detail is
lost on the fainter emission lines. So a balance must be reached between
realism and optimum emission line contrast.
If the continuum is too bright this reduces the contrast and some detail is
lost on the fainter emission lines. So a balance must be reached between
realism and optimum emission line contrast.
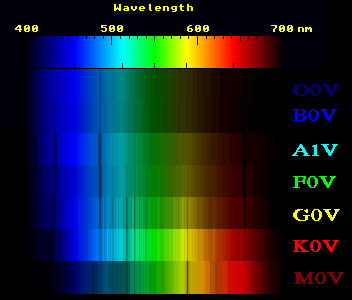 Digitized spectra of O, B, A, F, G, K, M type stars from the NASA database.
Data from ADC
catalog A3092,
from a paper by
Jacoby et al. (1984)
'A Library of Stellar Spectra'.
Digitized spectra of O, B, A, F, G, K, M type stars from the NASA database.
Data from ADC
catalog A3092,
from a paper by
Jacoby et al. (1984)
'A Library of Stellar Spectra'.
The next page contains a sample of star spectra from this publication plotted at 916 x 80 pixel resolution in color for realism.