Similarity with Upsilon Sagittarii
A comparison of the absorption lines in the spectrum of 0237-233 in the interval
3716-4290 Å with the spectrum of the star upsilon Sgr shows that many of the identifications
are common. Not only that, most of the unidentified lines in 0237-233 are common
with unidentified lines in the spectrum of upsilon Sgr. Clearly a comparison between other
spectral properties is of interest.
First we briefly summarize some of the important data about upsilon Sgr. The rich spectrum
of upsilon Sagittarii (HD 181615; mag. 4.6; spect. B8-A2 Ia) has been investigated by a
number of workers (Plaskett, 1928 ; Greenstein, 1940, 1943. Greenstein and Merrill,
1946; Greenstein and Adams, 1947). A strong helium spectrum is superposed on a
complex metallic spectrum. Hydrogen lines are unusually weak. Emission lines are also
present in the red and infra-red regions - Hydrogen alpha and those of Ca II and [Ca II], Fe II and
possibly [Fe II] . It is believed there is an extended nebulous envelope around the star.
Hack and Pasinetti (1963) found that the star is deficient in hydrogen and estimated
n(H)/n(He) = 0.025. A more recent analysis by
Schoenberner and Drilling (1983)
indicates a much lower hydrogen abundance, i.e., n(H)/n(He) less that 0.0005. The observed
spectrum is that of a single star. This star is a member of a binary system (Wilson, 1914).
In the visible region no spectroscopic evidence has been detected of the other member,
but in the ultraviolet region, spectroscopic evidence has been obtained recently
(Parthasarathy et al., 1986).
Next we compare 0237-233 with upsilon Sgr.
- The absorption line spectra of the two objects are rather similar. Both objects are
strongly deficient in hydrogen.
- Both objects show emission lines in their spectra, but the nature ofthe emission
lines in the two is different. The emission lines in 0237-233 are broad, while those in
upsilon Sgr are relatively sharp. Upsilon Sgr shows several emission lines in the red region
(Greenstein and Merrill, 1946). It would be of interest to investigate if there is any
emission at those wavelengths in 0237-233.

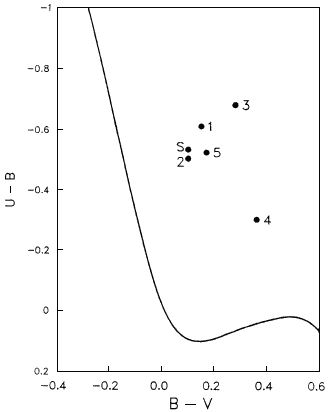
Fig.2. (U-B) versus (B-V) plot. Key to points 1: 0237-233, 2: 0851+197,
3: 1225+317, 4: 1246-057, 5: 1448-232, S: Upsilon Sgr.
- In Figure 2 we show the positions of 0237-233 and upsilon Sgr on the two-colour
(U-B) versus (B-V) plot. The positions of a few other quasars in
Table I
for which data are available and also shown.
0237-233 and upsilon Sgr are seen to be very close on this plot.

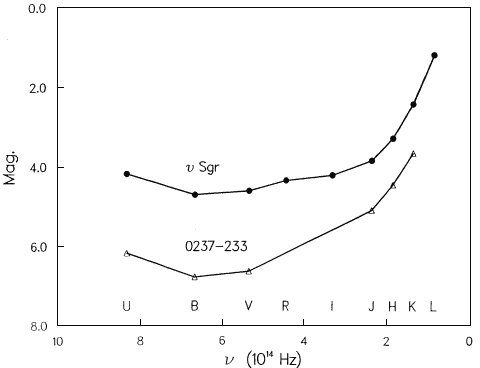
Fig.3. The colours of Upsilon Sgr and 0237-233. The data points for Upsilon Sgr are from
Lee and Nariai (1976)
and those for 0237-233, from
Hewitt and Burbidge (1987)
and
Hyland and Allen (1983).
To accomodate the two objects on the same plot, the magnitudes for 0237-233 have been increased by 10.
- Both objects show large infrared excesses. Infrared photometry of upsilon Sgr has been carried out by
Lee and Nariai (1967),
Woolf (1973),
and by
Treffers et al. (1976),
and that of 0237-233 by
Hyland and Allen (1982).
In Figure 3 we compare the colours of
0237-233 with those of upsilon Sgr. It will be noted that both objects are very red at long
wavelengths and the spectral energy distributions of the two are very similar. Two
hypotheses have been advanced to explain the infra-red excess in upsilon Sgr. A late-type
secondary or the circumstellar envelope.
Parthasarathy et al. (1986)
have found that the
companion is a hot star (late O or early B-type). Thus the second possibility seems most
likely (see also
Treffers et al., 1976).
In the case of 0237-233, it is a natural consequence
of our theory that the ejected material from the star will form a circumstellar envelope
and in due course some of it will condense to form dust, which will lead to infrared
excess. Upsilon Sgr shows a 10 micron emission feature
(Treffers et al., 1976),
which is similar to
the 10 micron emission feature found around oxygen-rich stars and interpreted as being due
to silicates. Irrespective of its interpretation it would be of interest to investigate if
0237-233 also shows the 10 micron emission feature.

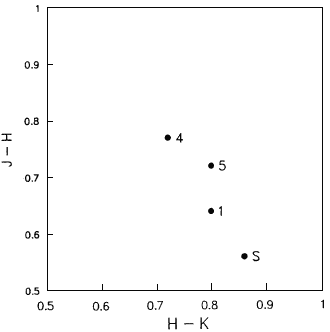
Fig.4. The (J-H) versus (H-K) diagram for 3 quasars and Upsilon Sgr. Symbols
have the same meaning as in Figure 2.
- The positions of 0237-233 and upsilon Sgr on the (J-H) versus (H-K) plot are shown
in Figure 4. Two other quasars in
Table I,
for which data are available, are also shown.
In judging the proximity of the points, it should be kept in mind that we have shown
here only a small portion of the usual (J-H) versus (H-K) diagram for quasars in which
both axes run from 0 to 1.5
(Hyland and Allen, 1982).
Again, here also, as in Figure 2,
0237-233 and upsilon Sgr are seen to be in close proximity.
- The polarization in the optical region in both cases is small - about 0.25 percent for
0237-233
(Moore and Stockman, 1984)
and less than about 1 percent for upsilon Sgr
(Coyne and Gehrels, 1967).
It is not implied or suggested that the absolute magnitudes of 0237-233 and upsilon Sgr
(Rao and Venugopal, 1985) might be similar. Rather we think that 0237-233 is an
intrinsically fainter object
(Varshni, 1977a)
than upsilon Sgr. The spectral similarities between
the two are reminiscent of the spectral similarities between classical Wolf-Rayet stars
and some planetary nuclei. We suspect that 0237-233 has some relation with hydrogen-deficient
planetary nuclei (Mendez et al., 1986).
Upsilon Sgr is known to be a binary. Thus naturally the question arises if 0237-233 might
also be a binary. The historical light curve of 0237-233 has been summarized by
Angione (1973).
The available data are rather patchy but are suggestive of an eclipsing
binary nature.
Next Section : Predictions


