The PLS Model. We have shown above that the PLS model for quasars predicts large variations in the relative intensities of lines undergoing laser action. Given the appropriate conditions, laser action is possible in a great many spectral lines. Thus is is readily seen that quasars can be expected to show a great variety of spectra, which indeed is the case.
The Wolf-Rayet stars show broad emission lines, quite similar to those of quasars. Analogy is a powerful tool in science, and for identifying spectral lines in quasars, it is of obvious interest to compare such quasars and Wolf-Rayet stars which may have similar spectra.
Some planetary nuclei show Wolf_Rayet type of spectra. Smith and Aller (1969) have classified the emission line spectra of planetary nuclei in five classes - one of these is called the 'O VI sequence'. The defining characteristic of this class is the presence of emission lines due to the O VI doublet 3811, 3834 Å among the strongest lines in the spectrum. In addition, emission lines C IV 4658 Å and He II 4686 Å are also present and are usually of comparable intensity to the O VI lines. Smith and Aller have listed 12 such planetary nuclei. It was pointed out by Sanduleak that this variety of Wolf-Rayet like spectrum (O VI sequence) also occurs in stars that do not appear to be planetary nuclei. He provides a list of five such stars.

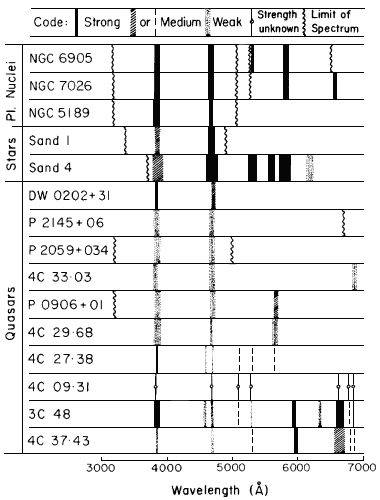
Fig.4. Diagrammatic representation of the spectra of the following:
(A) Central stars of three planetaries, (B) Stars Sand 1 and Sand 4, and
(C) Ten quasars. The code for the strengths of the lines is explained at the
top of the diagram. The wavy vertical lines indicate, where known, the limits(s)
of the observed spectrum.
In the course of our analysis of the spectra of quasars, we have found that there are at least fourteen quasars whose emission line spectra (as observed, no redshift) belong to the O VI sequence. In figure 4 we show a diagrammatic representation of the spectra of three of the planetary nuclei (NGC 6905, NGC 7026, NGC 5189), two of the Sanduleak stars (Sand 1 and Sand 4), and ten of the quasars, belonging to the O VI sequence. (Only the strong lines in the spectra of planetary nuclei are shown.) The continuity and similarity between the spectra of these objects is obvious. We do not require any redshifts to identify the spectral lines in planetary nuclei and Sanduleak stars; we fail to see any reason why one should invoke empty multiplying numbers to identify the spectral lines in quasars. This reference gives details of identification of quasar lines shown in Fig.4.